
- Start >
- Rivers >
- Waterlevel >
- Unterer Main >
- Oberthulba >
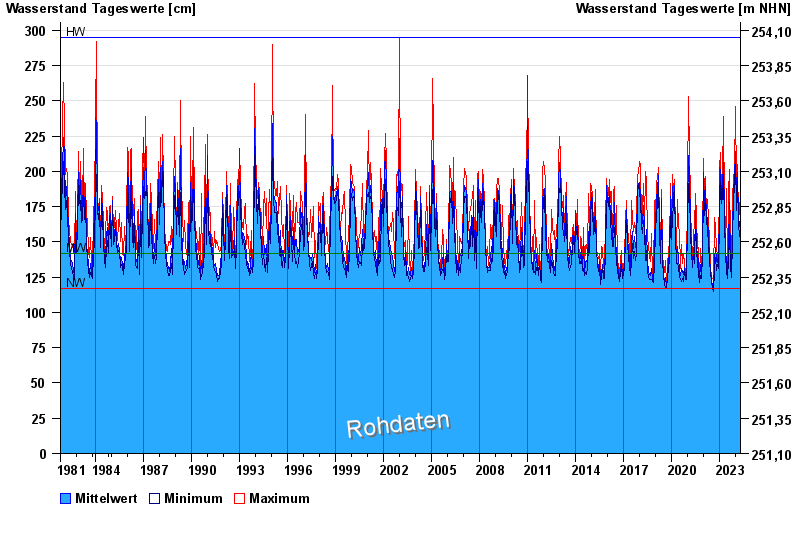
- Chart of total period

Chart of total period Oberthulba / Thulba
Waterlevel from 01.11.1981 to 23.04.2024
| Date | Mean value [cm] | Maximum [cm] | Minimum [cm] |
|---|---|---|---|
| 23.04.2024 | 158 | 159 | 157 |
| 22.04.2024 | 162 | 166 | 159 |
| 21.04.2024 | 169 | 178 | 159 |
| 20.04.2024 | 169 | 180 | 159 |
| 19.04.2024 | 158 | 184 | 145 |
| 18.04.2024 | 148 | 151 | 144 |
| 17.04.2024 | 146 | 151 | 144 |
© Bayerisches Landesamt für Umwelt 2024