
- Start >
- Rivers >
- Waterlevel >
- Unterer Main >
- Leucherhof >
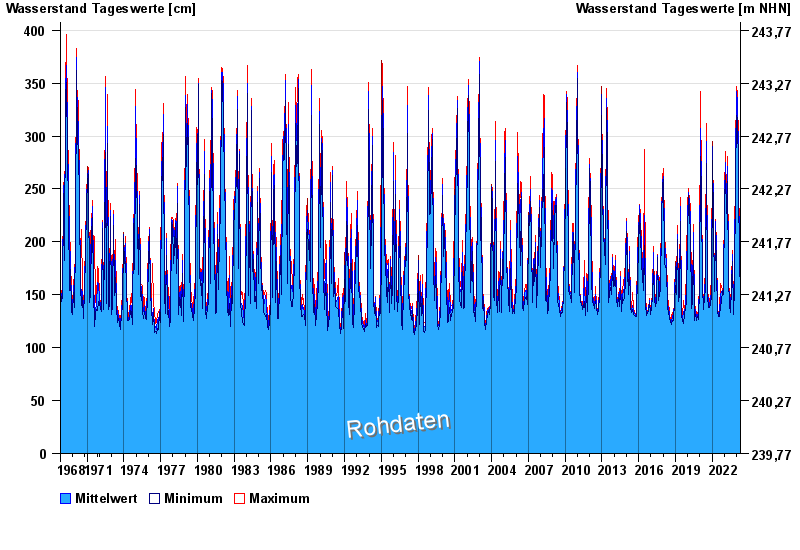
- Chart of total period

Chart of total period Leucherhof / Baunach
Waterlevel from 28.10.1968 to 25.04.2024
| Date | Mean value [cm] | Maximum [cm] | Minimum [cm] |
|---|---|---|---|
| 25.04.2024 | 149 | 151 | 148 |
| 24.04.2024 | 153 | 156 | 151 |
| 23.04.2024 | 161 | 170 | 156 |
| 22.04.2024 | 178 | 181 | 170 |
| 21.04.2024 | 168 | 180 | 160 |
| 20.04.2024 | 170 | 175 | 161 |
| 19.04.2024 | 146 | 160 | 142 |
© Bayerisches Landesamt für Umwelt 2024