
- Start >
- Rivers >
- Waterlevel >
- Unterer Main >
- Laubendorf >
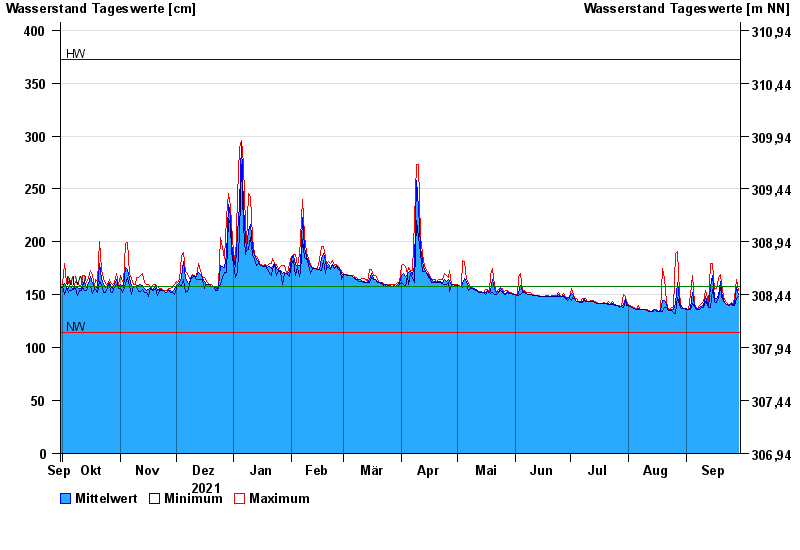
- Chart of year

Chart of year Laubendorf / Zenn
Waterlevel from 30.09.2021 to 29.09.2022
| Date | Mean value [cm] | Maximum [cm] | Minimum [cm] |
|---|---|---|---|
| 29.09.2022 | 150 | 154 | 148 |
| 28.09.2022 | 157 | 164 | 146 |
| 27.09.2022 | 143 | 147 | 140 |
| 26.09.2022 | 140 | 142 | 140 |
| 25.09.2022 | 142 | 143 | 141 |
| 24.09.2022 | 140 | 141 | 140 |
| 23.09.2022 | 141 | 142 | 141 |
© Bayerisches Landesamt für Umwelt 2024