
- Start >
- Rivers >
- Waterlevel >
- Unterer Main >
- Heinersdorf >
- Chart of year

Chart of year Heinersdorf / Rodach
Waterlevel from 31.07.2020 to 30.07.2021
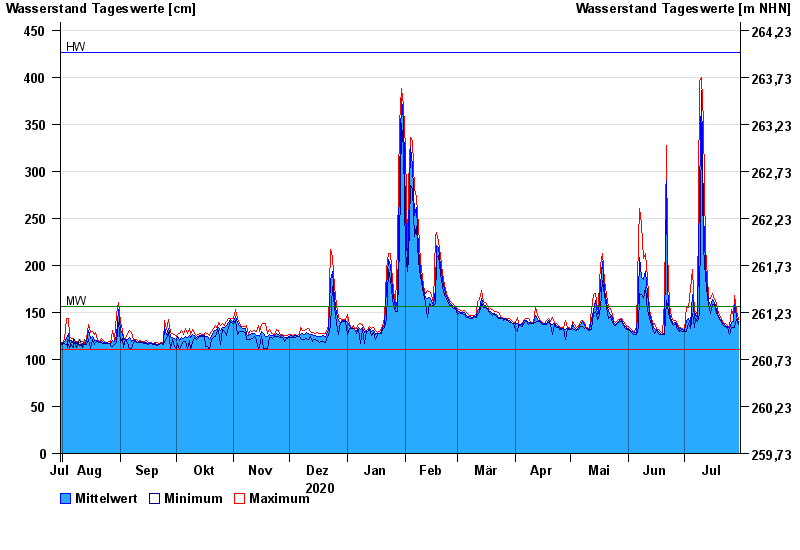
| Date | Mean value [cm] | Maximum [cm] | Minimum [cm] |
|---|---|---|---|
| 30.07.2021 | 139 | 142 | 137 |
| 29.07.2021 | 146 | 151 | 142 |
| 28.07.2021 | 158 | 168 | 134 |
| 27.07.2021 | 140 | 147 | 134 |
| 26.07.2021 | 139 | 153 | 134 |
| 25.07.2021 | 133 | 135 | 127 |
| 24.07.2021 | 135 | 136 | 134 |
© Bayerisches Landesamt für Umwelt 2024