
- Start >
- Rivers >
- Waterlevel >
- Unterer Main >
- Heinersdorf >
- Chart of total period

Chart of total period Heinersdorf / Rodach
Waterlevel from 28.10.1963 to 25.04.2024
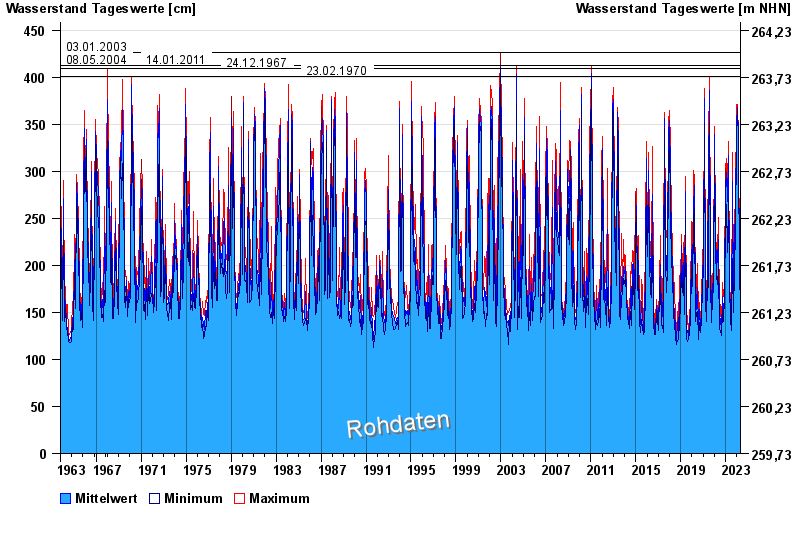
- 03.01.2003 Wasserstand: 426 cm
- 08.05.2004 Wasserstand: 413 cm
- 14.01.2011 Wasserstand: 412 cm
- 24.12.1967 Wasserstand: 409 cm
- 23.02.1970 Wasserstand: 401 cm
| Date | Mean value [cm] | Maximum [cm] | Minimum [cm] |
|---|---|---|---|
| 25.04.2024 | 156 | 156 | 155 |
| 24.04.2024 | 155 | 157 | 153 |
| 23.04.2024 | 159 | 163 | 157 |
| 22.04.2024 | 167 | 175 | 160 |
| 21.04.2024 | 177 | 184 | 167 |
| 20.04.2024 | 176 | 183 | 168 |
| 19.04.2024 | 155 | 174 | 150 |
© Bayerisches Landesamt für Umwelt 2024