
- Start >
- Rivers >
- Waterlevel >
- Unterer Main >
- Gollmuthhausen >
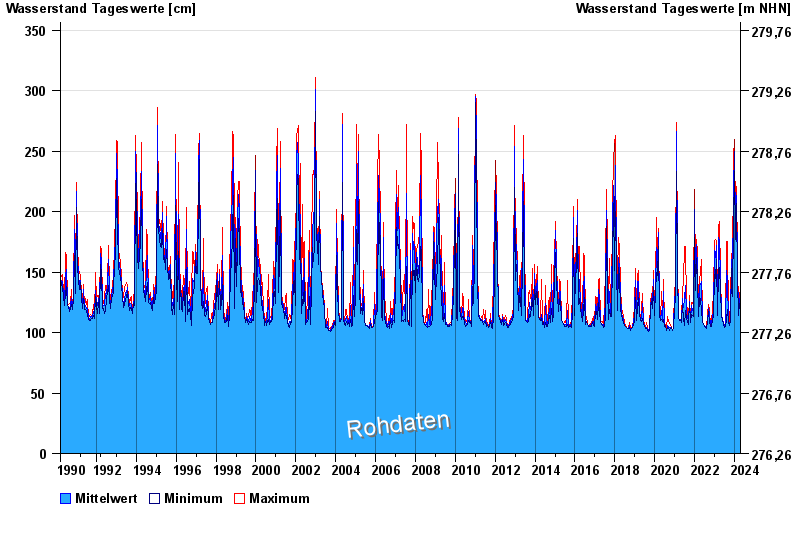
- Chart of total period

Chart of total period Gollmuthhausen / Milz
Waterlevel from 14.03.1990 to 20.04.2024
| Date | Mean value [cm] | Maximum [cm] | Minimum [cm] |
|---|---|---|---|
| 20.04.2024 | 118 | 119 | 115 |
| 19.04.2024 | 112 | 115 | 112 |
| 18.04.2024 | 112 | 112 | 112 |
| 17.04.2024 | 113 | 114 | 112 |
| 16.04.2024 | 112 | 113 | 112 |
| 15.04.2024 | 112 | 113 | 112 |
| 14.04.2024 | 113 | 113 | 112 |
© Bayerisches Landesamt für Umwelt 2024