
- Start >
- Rivers >
- Waterlevel >
- Unterer Main >
- Füssen >
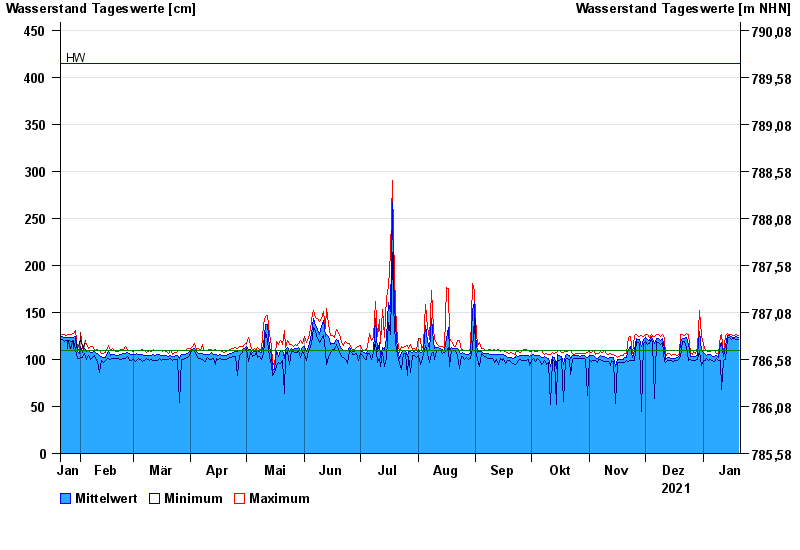
- Chart of year

Chart of year Füssen / Lech
Waterlevel from 21.01.2021 to 20.01.2022
| Date | Mean value [cm] | Maximum [cm] | Minimum [cm] |
|---|---|---|---|
| 20.01.2022 | 123 | 125 | 121 |
| 19.01.2022 | 124 | 126 | 121 |
| 18.01.2022 | 123 | 125 | 122 |
| 17.01.2022 | 123 | 125 | 122 |
| 16.01.2022 | 124 | 126 | 121 |
| 15.01.2022 | 125 | 127 | 123 |
| 14.01.2022 | 125 | 128 | 122 |
© Bayerisches Landesamt für Umwelt 2024