
- Start >
- Rivers >
- Waterlevel >
- Unterer Main >
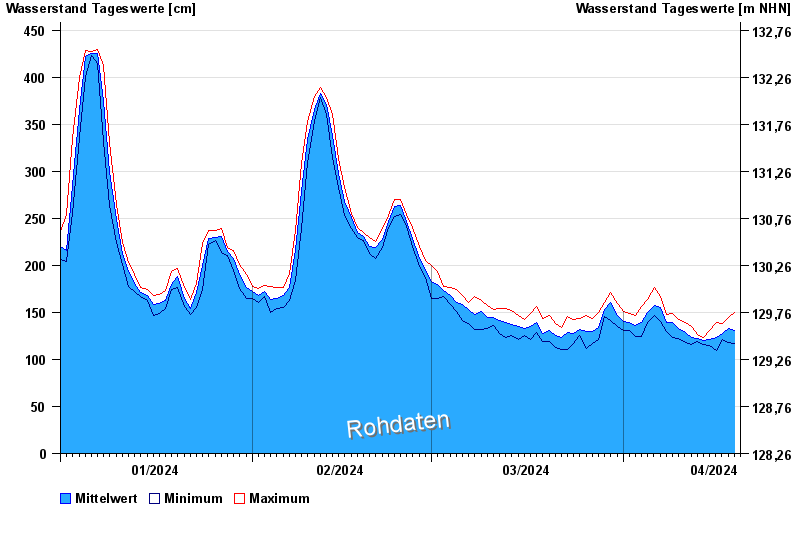
- Faulbach >
- Chart of year

Chart of year Faulbach / Main
Waterlevel from 01.01.2024 to 19.04.2024
- 26.02.1970 Wasserstand: 681 cm
- 30.01.1995 Wasserstand: 666 cm
- 04.01.2003 Wasserstand: 653 cm
- 29.03.1988 Wasserstand: 647 cm
- 17.01.2011 Wasserstand: 646 cm
| Date | Mean value [cm] | Maximum [cm] | Minimum [cm] |
|---|---|---|---|
| 19.04.2024 | 130 | 150 | 117 |
| 18.04.2024 | 133 | 145 | 118 |
| 17.04.2024 | 128 | 138 | 121 |
| 16.04.2024 | 123 | 139 | 109 |
| 15.04.2024 | 121 | 131 | 115 |
| 14.04.2024 | 120 | 123 | 116 |
| 13.04.2024 | 122 | 127 | 119 |
© Bayerisches Landesamt für Umwelt 2024