
- Start >
- Rivers >
- Waterlevel >
- Unterer Main >
- Binzwangen >
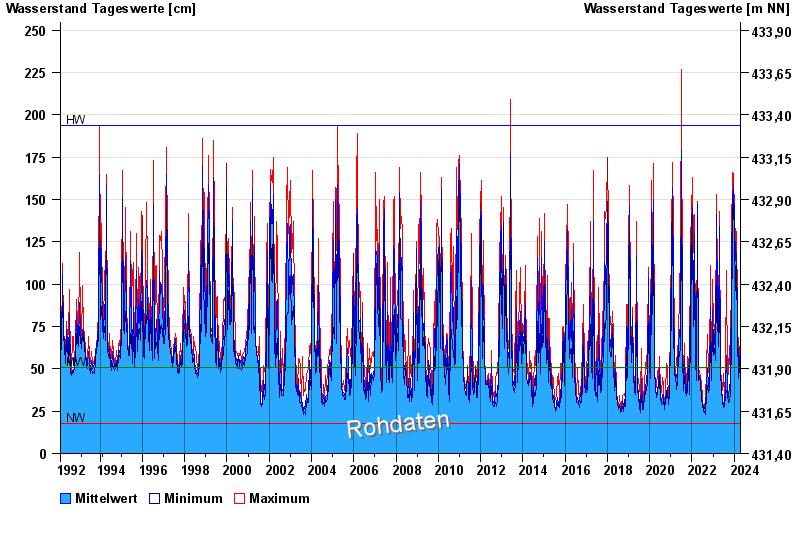
- Chart of total period

Chart of total period Binzwangen / Altmühl
Waterlevel from 15.02.1992 to 19.04.2024
note
Wasserstand und Abfluss wird zeitweise durch Biberdamm beeinflusst.
| Date | Mean value [cm] | Maximum [cm] | Minimum [cm] |
|---|---|---|---|
| 19.04.2024 | 41 | 41 | 41 |
| 18.04.2024 | 41 | 42 | 41 |
| 17.04.2024 | 44 | 48 | 42 |
| 16.04.2024 | 41 | 45 | 39 |
| 15.04.2024 | 39 | 39 | 39 |
| 14.04.2024 | 40 | 40 | 39 |
| 13.04.2024 | 38 | 39 | 37 |
© Bayerisches Landesamt für Umwelt 2024