
- Start >
- Rivers >
- Waterlevel >
- Unterer Main >
- Astheim >
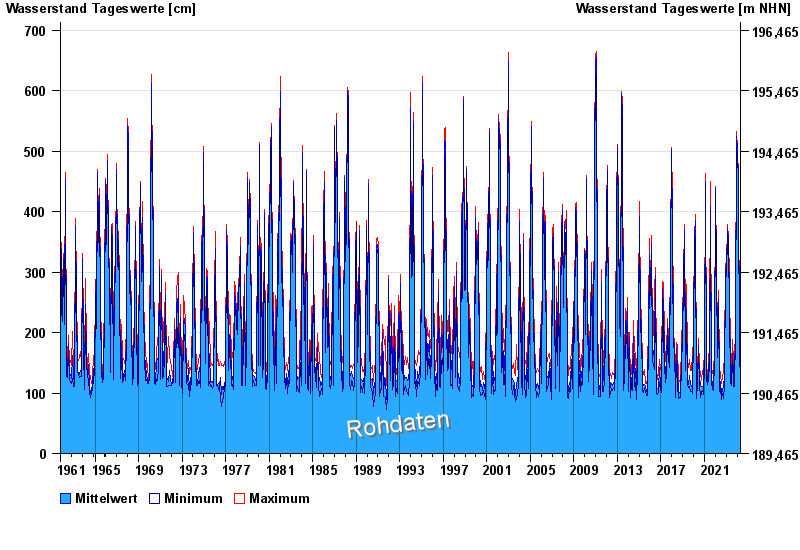
- Chart of total period

Chart of total period Astheim / Main
Waterlevel from 30.10.1961 to 25.04.2024
 Für diesen Pegel sind keine Meldestufen hinterlegt.
| Date | Mean value [cm] | Maximum [cm] | Minimum [cm] |
|---|---|---|---|
| 25.04.2024 | 194 | 205 | 185 |
| 24.04.2024 | 209 | 219 | 189 |
| 23.04.2024 | 230 | 243 | 216 |
| 22.04.2024 | 233 | 244 | 224 |
| 21.04.2024 | 214 | 229 | 190 |
| 20.04.2024 | 171 | 190 | 144 |
| 19.04.2024 | 149 | 158 | 137 |
© Bayerisches Landesamt für Umwelt 2024