
- Start >
- Rivers >
- Waterlevel >
- Unterer Main >
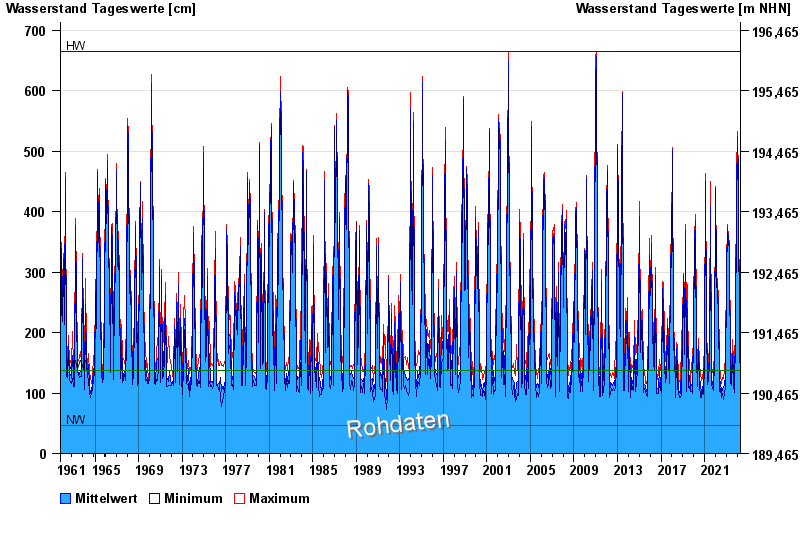
- Astheim >
- Chart of total period

Chart of total period Astheim / Main
Waterlevel from 30.10.1961 to 19.04.2024
| Date | Mean value [cm] | Maximum [cm] | Minimum [cm] |
|---|---|---|---|
| 19.04.2024 | 148 | 158 | 137 |
| 18.04.2024 | 152 | 161 | 146 |
| 17.04.2024 | 150 | 173 | 131 |
| 16.04.2024 | 138 | 141 | 131 |
| 15.04.2024 | 134 | 140 | 129 |
| 14.04.2024 | 136 | 142 | 134 |
| 13.04.2024 | 137 | 142 | 129 |
© Bayerisches Landesamt für Umwelt 2024