
- Start >
- Rivers >
- Waterlevel >
- Unterer Main >
- Amorbach >
- Chart of total period

Chart of total period Amorbach / Billbach
Waterlevel from 26.04.2013 to 19.04.2024
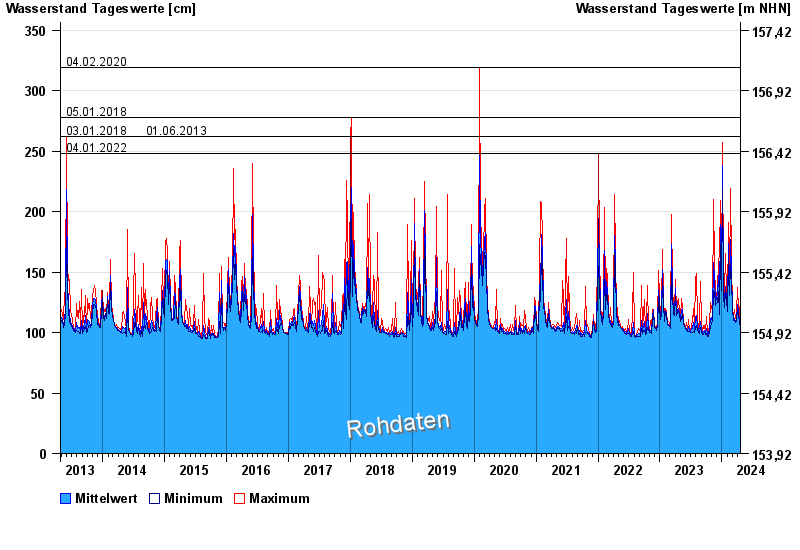
- 04.02.2020 Wasserstand: 319 cm
- 05.01.2018 Wasserstand: 278 cm
- 03.01.2018 Wasserstand: 262 cm
- 01.06.2013 Wasserstand: 262 cm
- 04.01.2022 Wasserstand: 248 cm
| Date | Mean value [cm] | Maximum [cm] | Minimum [cm] |
|---|---|---|---|
| 19.04.2024 | 106 | 107 | 106 |
| 18.04.2024 | 106 | 108 | 106 |
| 17.04.2024 | 108 | 114 | 107 |
| 16.04.2024 | 109 | 113 | 106 |
| 15.04.2024 | 106 | 107 | 106 |
| 14.04.2024 | 106 | 106 | 106 |
| 13.04.2024 | 106 | 106 | 106 |
© Bayerisches Landesamt für Umwelt 2024