
- Start >
- Rivers >
- Waterlevel >
- Unterer Main >
- Amorbach >
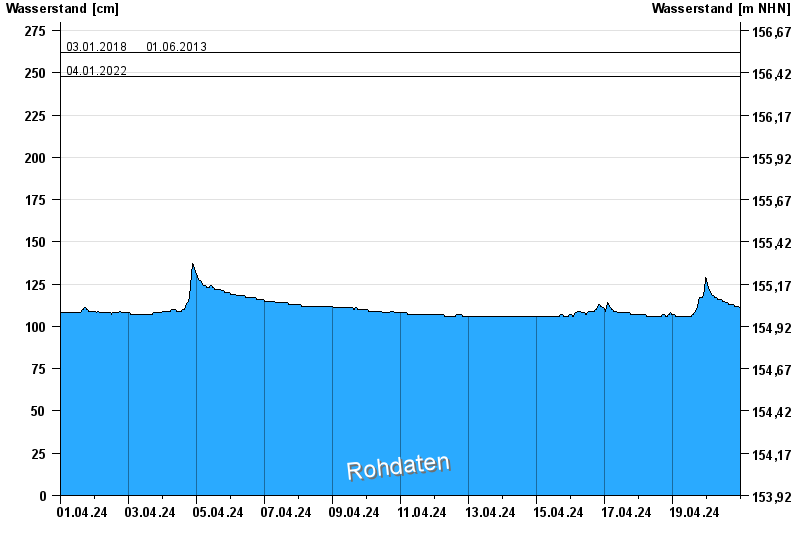
- Chart of month

Chart of month Amorbach / Billbach
Waterlevel from 01.04.2024 to 20.04.2024
- 04.02.2020 Wasserstand: 319 cm
- 05.01.2018 Wasserstand: 278 cm
- 03.01.2018 Wasserstand: 262 cm
- 01.06.2013 Wasserstand: 262 cm
- 04.01.2022 Wasserstand: 248 cm
| Date | Waterlevel [cm] |
|---|---|
| 20.04.2024 04:00 | 118 |
| 20.04.2024 03:45 | 119 |
| 20.04.2024 03:30 | 119 |
| 20.04.2024 03:15 | 119 |
| 20.04.2024 03:00 | 119 |
| 20.04.2024 02:45 | 120 |
| 20.04.2024 02:30 | 120 |
© Bayerisches Landesamt für Umwelt 2024