
- Start >
- Rivers >
- Waterlevel >
- Obere Donau >
- Winkl >
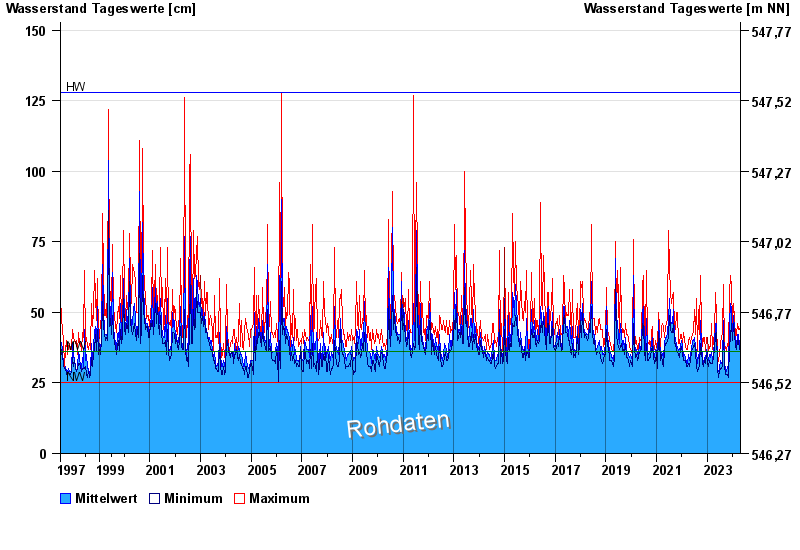
- Chart of total period

Chart of total period Winkl / Verlorener Bach
Waterlevel from 25.06.1997 to 24.04.2024
note
Messwerte beeinflusst durch Kraftwerkssteuerungen.
| Date | Mean value [cm] | Maximum [cm] | Minimum [cm] |
|---|---|---|---|
| 24.04.2024 | 38 | 38 | 37 |
| 23.04.2024 | 38 | 43 | 32 |
| 22.04.2024 | 38 | 39 | 38 |
| 21.04.2024 | 39 | 45 | 38 |
| 20.04.2024 | 39 | 40 | 37 |
| 19.04.2024 | 38 | 39 | 38 |
| 18.04.2024 | 39 | 40 | 38 |
© Bayerisches Landesamt für Umwelt 2024