
- Start >
- Rivers >
- Waterlevel >
- Obere Donau >
- Wiblingen >
- Chart of year

Chart of year Wiblingen / Iller
Waterlevel from 28.02.2020 to 27.02.2021
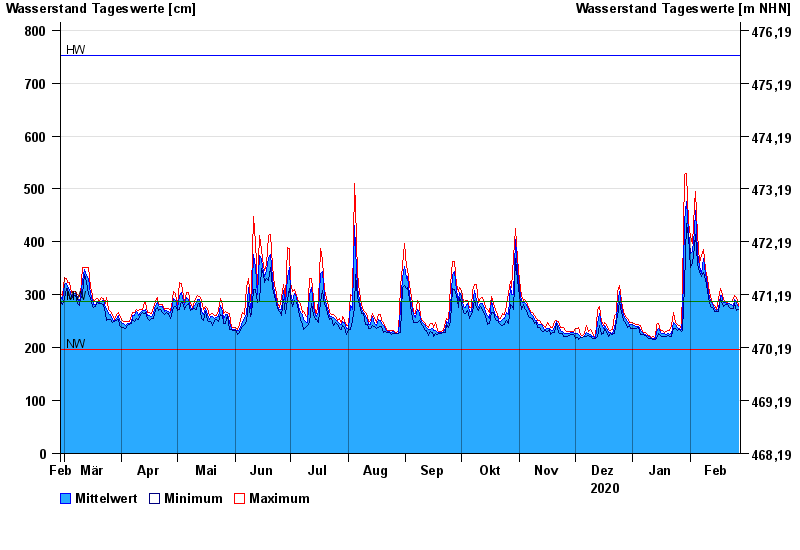
| Date | Mean value [cm] | Maximum [cm] | Minimum [cm] |
|---|---|---|---|
| 27.02.2021 | 278 | 279 | 273 |
| 26.02.2021 | 284 | 295 | 270 |
| 25.02.2021 | 291 | 299 | 283 |
| 24.02.2021 | 278 | 292 | 274 |
| 23.02.2021 | 282 | 288 | 274 |
| 22.02.2021 | 284 | 288 | 276 |
| 21.02.2021 | 284 | 286 | 282 |
© Bayerisches Landesamt für Umwelt 2024