
- Start >
- Rivers >
- Waterlevel >
- Obere Donau >
- Wiblingen >
- Chart of year

Chart of year Wiblingen / Iller
Waterlevel from 05.03.2021 to 04.03.2022
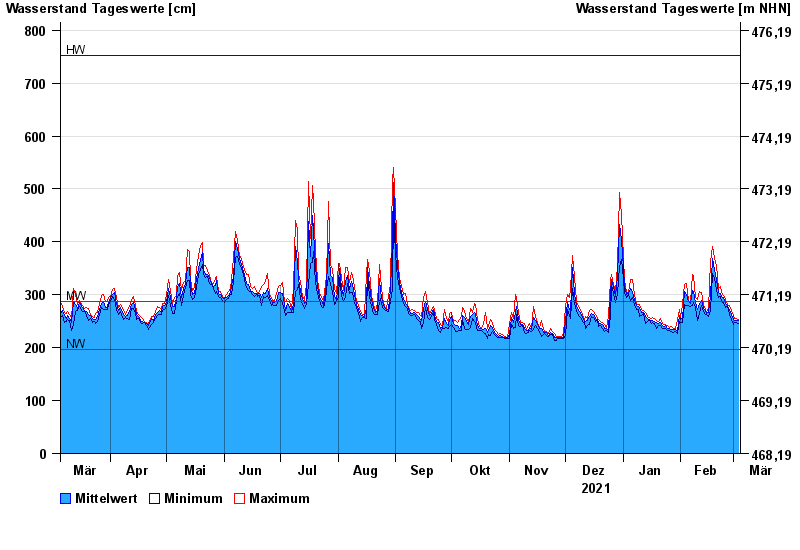
| Date | Mean value [cm] | Maximum [cm] | Minimum [cm] |
|---|---|---|---|
| 04.03.2022 | 251 | 254 | 245 |
| 03.03.2022 | 252 | 255 | 248 |
| 02.03.2022 | 251 | 255 | 247 |
| 01.03.2022 | 254 | 261 | 243 |
| 28.02.2022 | 263 | 270 | 253 |
| 27.02.2022 | 271 | 280 | 263 |
| 26.02.2022 | 279 | 282 | 277 |
© Bayerisches Landesamt für Umwelt 2024