
- Start >
- Rivers >
- Waterlevel >
- Obere Donau >
- Wiblingen >
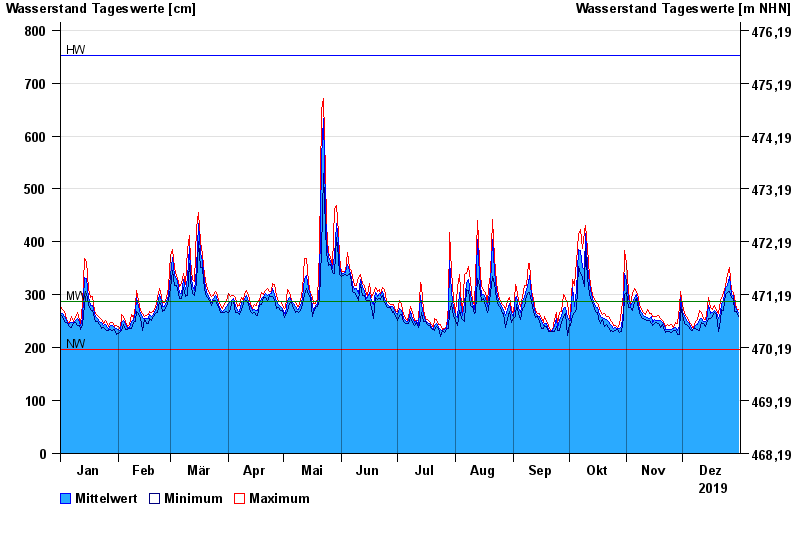
- Chart of year

Chart of year Wiblingen / Iller
Waterlevel from 01.01.2019 to 31.12.2019
| Date | Mean value [cm] | Maximum [cm] | Minimum [cm] |
|---|---|---|---|
| 31.12.2019 | 266 | 273 | 259 |
| 30.12.2019 | 272 | 274 | 269 |
| 29.12.2019 | 281 | 294 | 268 |
| 28.12.2019 | 299 | 304 | 293 |
| 27.12.2019 | 300 | 309 | 294 |
| 26.12.2019 | 335 | 352 | 307 |
| 25.12.2019 | 317 | 338 | 305 |
© Bayerisches Landesamt für Umwelt 2024