
- Start >
- Rivers >
- Waterlevel >
- Obere Donau >
- Wiblingen >
- Chart of year

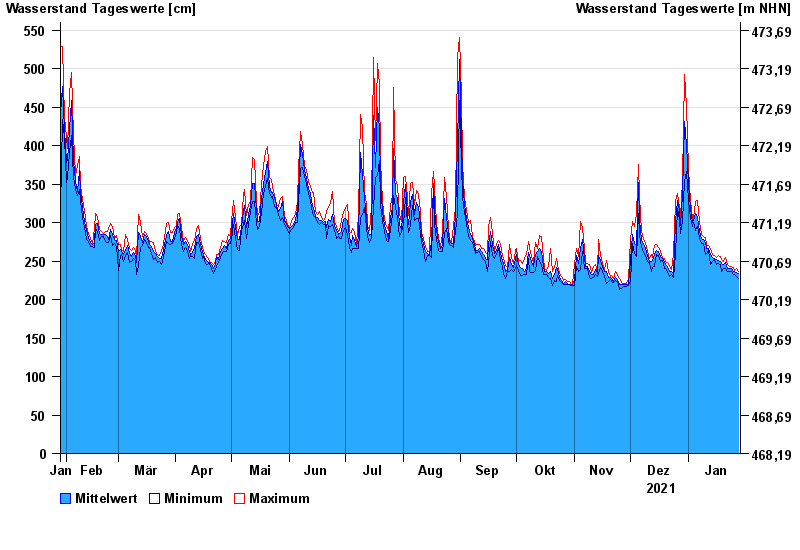
Chart of year Wiblingen / Iller
Waterlevel from 29.01.2021 to 28.01.2022
- 23.05.1999 Wasserstand: 752 cm
- 24.08.2005 Wasserstand: 739 cm
- 02.06.2013 Wasserstand: 705 cm
- 13.08.2002 Wasserstand: 694 cm
- 13.05.1999 Wasserstand: 664 cm
| Date | Mean value [cm] | Maximum [cm] | Minimum [cm] |
|---|---|---|---|
| 28.01.2022 | 234 | 237 | 228 |
| 27.01.2022 | 235 | 240 | 230 |
| 26.01.2022 | 236 | 238 | 233 |
| 25.01.2022 | 237 | 242 | 233 |
| 24.01.2022 | 241 | 243 | 237 |
| 23.01.2022 | 240 | 243 | 236 |
| 22.01.2022 | 241 | 245 | 237 |
© Bayerisches Landesamt für Umwelt 2024