
- Start >
- Rivers >
- Waterlevel >
- Obere Donau >
- Wiblingen >
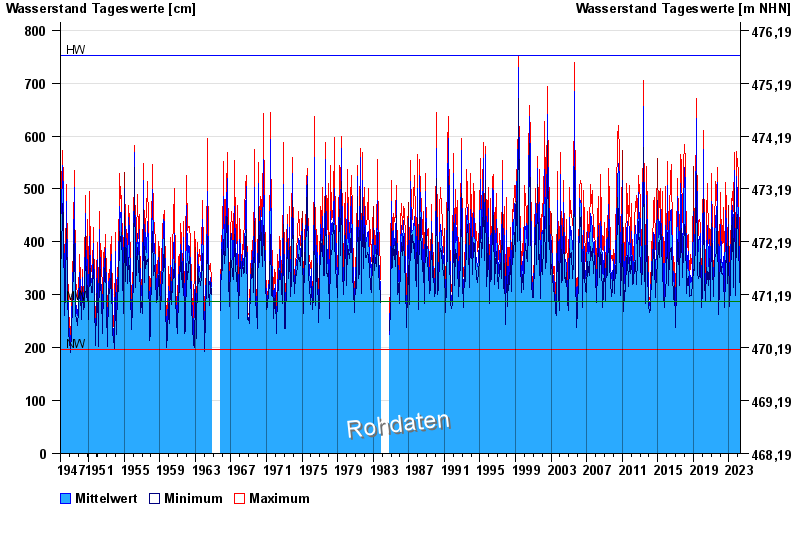
- Chart of total period

Chart of total period Wiblingen / Iller
Waterlevel from 01.11.1947 to 19.04.2024
| Date | Mean value [cm] | Maximum [cm] | Minimum [cm] |
|---|---|---|---|
| 19.04.2024 | 320 | 323 | 312 |
| 18.04.2024 | 323 | 339 | 302 |
| 17.04.2024 | 311 | 335 | 299 |
| 16.04.2024 | 323 | 332 | 312 |
| 15.04.2024 | 302 | 317 | 288 |
| 14.04.2024 | 287 | 293 | 282 |
| 13.04.2024 | 280 | 289 | 272 |
© Bayerisches Landesamt für Umwelt 2024