
- Start >
- Rivers >
- Waterlevel >
- Obere Donau >
- Wiblingen >
- Chart of total period

Chart of total period Wiblingen / Iller
Waterlevel from 01.11.1947 to 24.04.2024
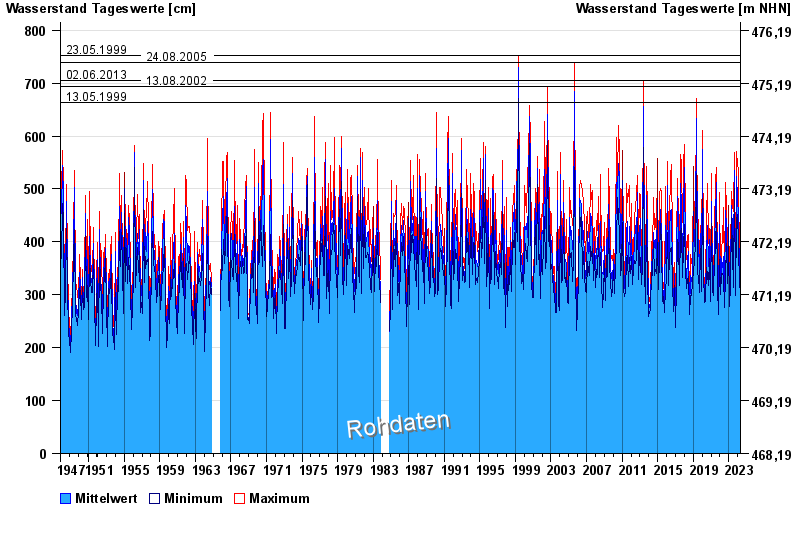
- 23.05.1999 Wasserstand: 752 cm
- 24.08.2005 Wasserstand: 739 cm
- 02.06.2013 Wasserstand: 705 cm
- 13.08.2002 Wasserstand: 694 cm
- 13.05.1999 Wasserstand: 664 cm
| Date | Mean value [cm] | Maximum [cm] | Minimum [cm] |
|---|---|---|---|
| 24.04.2024 | 294 | 297 | 292 |
| 23.04.2024 | 300 | 308 | 294 |
| 22.04.2024 | 317 | 324 | 297 |
| 21.04.2024 | 324 | 330 | 320 |
| 20.04.2024 | 333 | 341 | 310 |
| 19.04.2024 | 322 | 327 | 312 |
| 18.04.2024 | 323 | 339 | 302 |
© Bayerisches Landesamt für Umwelt 2024