
- Start >
- Rivers >
- Waterlevel >
- Obere Donau >
- Treuchtlingen >
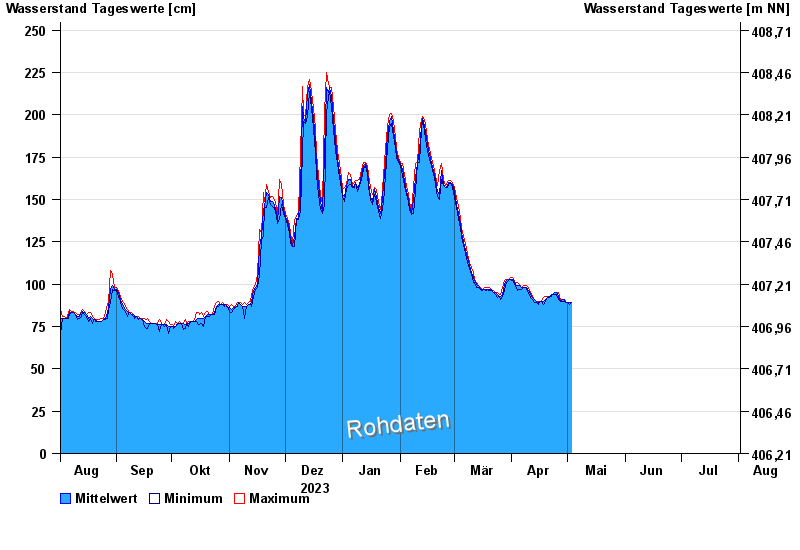
- Chart of year

Chart of year Treuchtlingen / Altmühl
Waterlevel from 02.08.2023 to 01.08.2024
| Date | Mean value [cm] | Maximum [cm] | Minimum [cm] |
|---|---|---|---|
| 23.04.2024 | 94 | 94 | 94 |
| 22.04.2024 | 94 | 94 | 93 |
| 21.04.2024 | 93 | 93 | 92 |
| 20.04.2024 | 92 | 93 | 92 |
| 19.04.2024 | 91 | 93 | 90 |
| 18.04.2024 | 90 | 92 | 88 |
| 17.04.2024 | 90 | 90 | 90 |
© Bayerisches Landesamt für Umwelt 2024