
- Start >
- Rivers >
- Waterlevel >
- Obere Donau >
- Treuchtlingen >
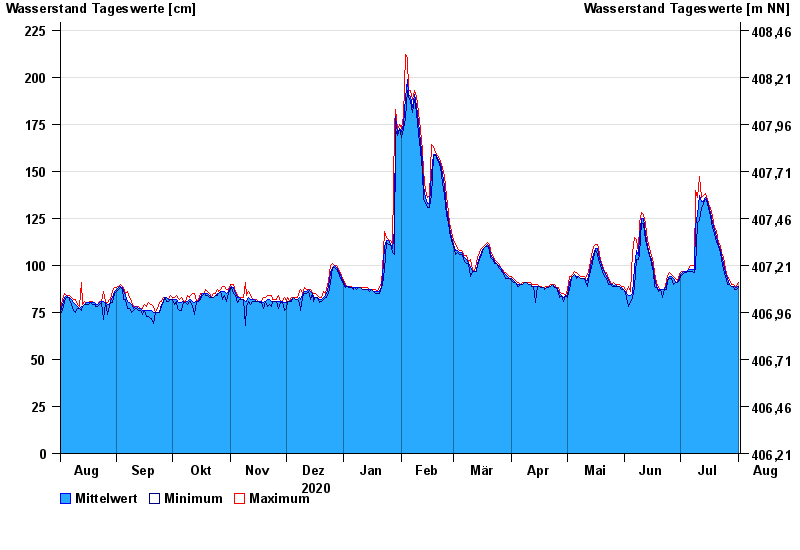
- Chart of year

Chart of year Treuchtlingen / Altmühl
Waterlevel from 02.08.2020 to 01.08.2021
- 18.03.1988 Wasserstand: 349 cm
- 15.04.1994 Wasserstand: 338 cm
- 22.12.1993 Wasserstand: 336 cm
- 04.03.1987 Wasserstand: 325 cm
- 27.03.1988 Wasserstand: 315 cm
| Date | Mean value [cm] | Maximum [cm] | Minimum [cm] |
|---|---|---|---|
| 01.08.2021 | 89 | 91 | 88 |
| 31.07.2021 | 88 | 89 | 87 |
| 30.07.2021 | 89 | 89 | 87 |
| 29.07.2021 | 89 | 90 | 89 |
| 28.07.2021 | 89 | 90 | 89 |
| 27.07.2021 | 90 | 92 | 90 |
| 26.07.2021 | 93 | 94 | 90 |
© Bayerisches Landesamt für Umwelt 2024