
- Start >
- Rivers >
- Waterlevel >
- Obere Donau >
- Thann >
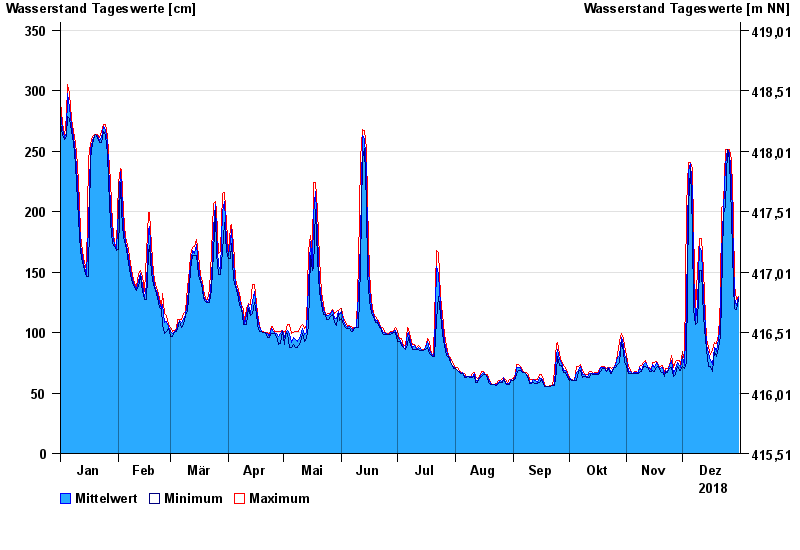
- Chart of year

Chart of year Thann / Altmühl
Waterlevel from 01.01.2018 to 31.12.2018
| Date | Mean value [cm] | Maximum [cm] | Minimum [cm] |
|---|---|---|---|
| 31.12.2018 | 129 | 130 | 127 |
| 30.12.2018 | 122 | 127 | 119 |
| 29.12.2018 | 128 | 139 | 120 |
| 28.12.2018 | 163 | 196 | 139 |
| 27.12.2018 | 225 | 243 | 196 |
| 26.12.2018 | 248 | 251 | 243 |
| 25.12.2018 | 251 | 251 | 251 |
© Bayerisches Landesamt für Umwelt 2024