
- Start >
- Rivers >
- Waterlevel >
- Obere Donau >
- Schwabach >
- Chart of total period

Chart of total period Schwabach / Schwabach
Waterlevel from 07.04.1993 to 20.04.2024
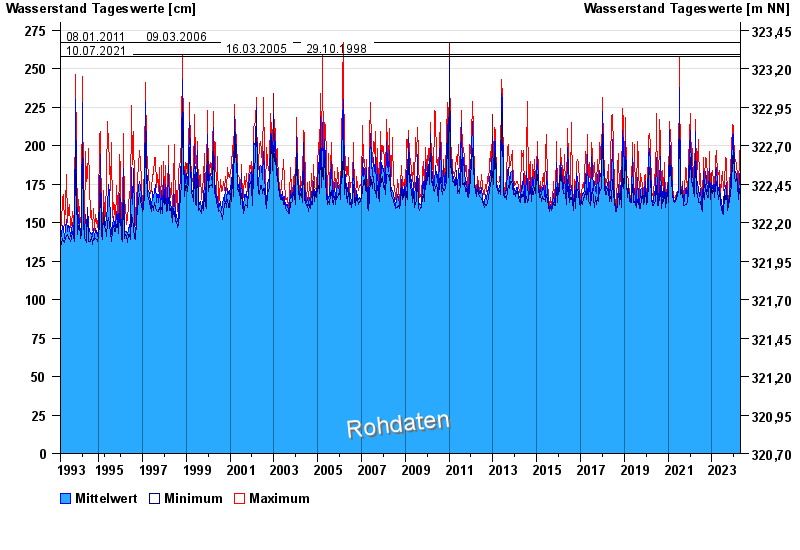
- 08.01.2011 Wasserstand: 267 cm
- 09.03.2006 Wasserstand: 267 cm
- 16.03.2005 Wasserstand: 259 cm
- 29.10.1998 Wasserstand: 259 cm
- 10.07.2021 Wasserstand: 258 cm
| Date | Mean value [cm] | Maximum [cm] | Minimum [cm] |
|---|---|---|---|
| 20.04.2024 | 177 | 177 | 176 |
| 19.04.2024 | 168 | 176 | 165 |
| 18.04.2024 | 167 | 171 | 165 |
| 17.04.2024 | 172 | 176 | 169 |
| 16.04.2024 | 168 | 172 | 165 |
| 15.04.2024 | 167 | 169 | 165 |
| 14.04.2024 | 165 | 166 | 164 |
© Bayerisches Landesamt für Umwelt 2024