
- Start >
- Rivers >
- Waterlevel >
- Obere Donau >
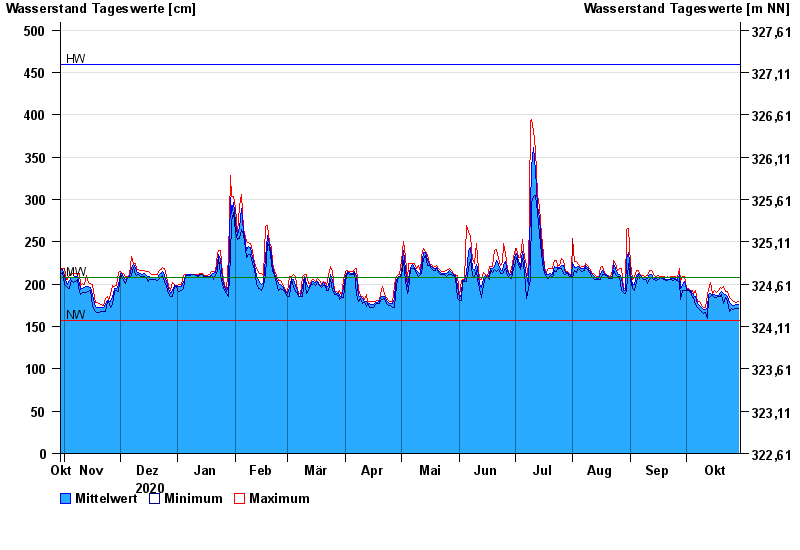
- Roth Kläranlage >
- Chart of year

Chart of year Roth Kläranlage / Rednitz
Waterlevel from 30.10.2020 to 29.10.2021
| Date | Mean value [cm] | Maximum [cm] | Minimum [cm] |
|---|---|---|---|
| 29.10.2021 | 176 | 179 | 171 |
| 28.10.2021 | 176 | 178 | 171 |
| 27.10.2021 | 175 | 180 | 171 |
| 26.10.2021 | 175 | 180 | 170 |
| 25.10.2021 | 176 | 182 | 171 |
| 24.10.2021 | 178 | 184 | 168 |
| 23.10.2021 | 185 | 191 | 179 |
© Bayerisches Landesamt für Umwelt 2024