
- Start >
- Rivers >
- Waterlevel >
- Obere Donau >
- Roth >
- Chart of total period

Chart of total period Roth / Roth
Waterlevel from 01.11.1978 to 17.04.2024
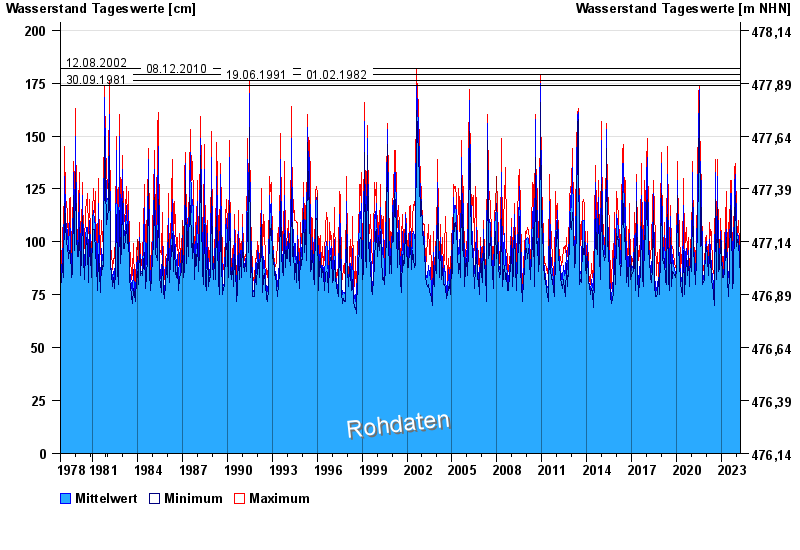
- 12.08.2002 Wasserstand: 182 cm
- 08.12.2010 Wasserstand: 179 cm
- 19.06.1991 Wasserstand: 176 cm
- 01.02.1982 Wasserstand: 176 cm
- 30.09.1981 Wasserstand: 174 cm
| Date | Mean value [cm] | Maximum [cm] | Minimum [cm] |
|---|---|---|---|
| 17.04.2024 | 83 | 84 | 83 |
| 16.04.2024 | 83 | 83 | 82 |
| 15.04.2024 | 81 | 85 | 78 |
| 14.04.2024 | 79 | 79 | 79 |
| 13.04.2024 | 79 | 80 | 78 |
| 12.04.2024 | 80 | 81 | 79 |
| 11.04.2024 | 81 | 81 | 80 |
© Bayerisches Landesamt für Umwelt 2024