
- Start >
- Rivers >
- Waterlevel >
- Obere Donau >
- Roth >
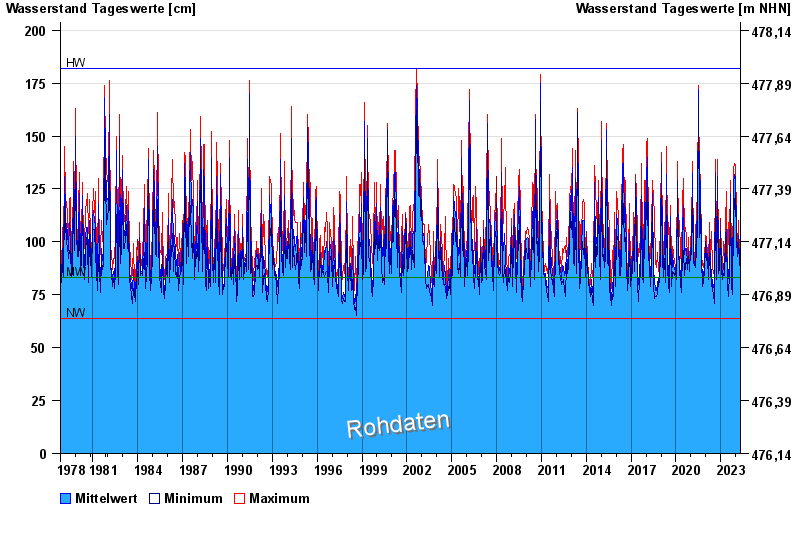
- Chart of total period

Chart of total period Roth / Roth
Waterlevel from 01.11.1978 to 24.04.2024
| Date | Mean value [cm] | Maximum [cm] | Minimum [cm] |
|---|---|---|---|
| 24.04.2024 | 86 | 86 | 86 |
| 23.04.2024 | 87 | 88 | 85 |
| 22.04.2024 | 89 | 90 | 88 |
| 21.04.2024 | 90 | 92 | 89 |
| 20.04.2024 | 93 | 95 | 90 |
| 19.04.2024 | 87 | 91 | 85 |
| 18.04.2024 | 85 | 86 | 84 |
© Bayerisches Landesamt für Umwelt 2024