
- Start >
- Rivers >
- Waterlevel >
- Obere Donau >
- Rennertshofen >
- Chart of total period

Chart of total period Rennertshofen / Ussel
Waterlevel from 18.05.2010 to 24.04.2024
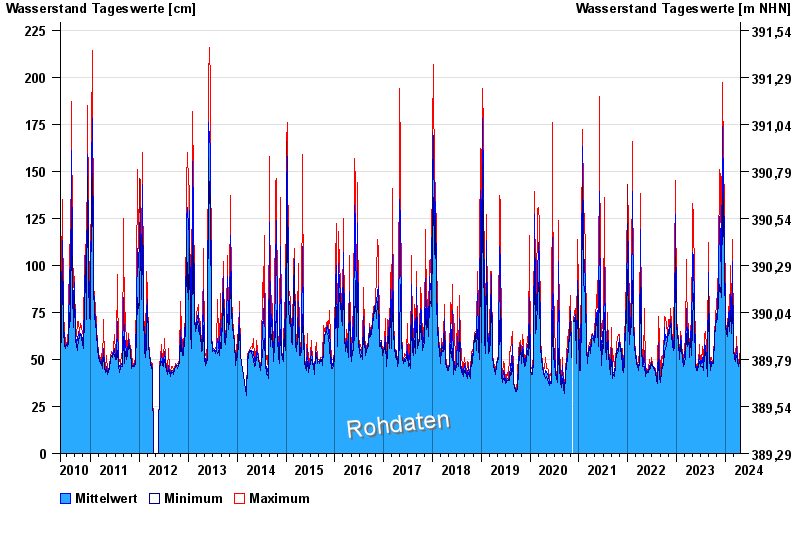
| Date | Mean value [cm] | Maximum [cm] | Minimum [cm] |
|---|---|---|---|
| 24.04.2024 | 49 | 49 | 48 |
| 23.04.2024 | 49 | 50 | 49 |
| 22.04.2024 | 50 | 51 | 50 |
| 21.04.2024 | 49 | 50 | 49 |
| 20.04.2024 | 50 | 53 | 47 |
| 19.04.2024 | 48 | 50 | 48 |
| 18.04.2024 | 48 | 49 | 48 |
© Bayerisches Landesamt für Umwelt 2024