
- Start >
- Rivers >
- Waterlevel >
- Obere Donau >
- Oberndorf >
- Chart of year

Chart of year Oberndorf / Donau
Waterlevel from 06.08.2021 to 05.08.2022
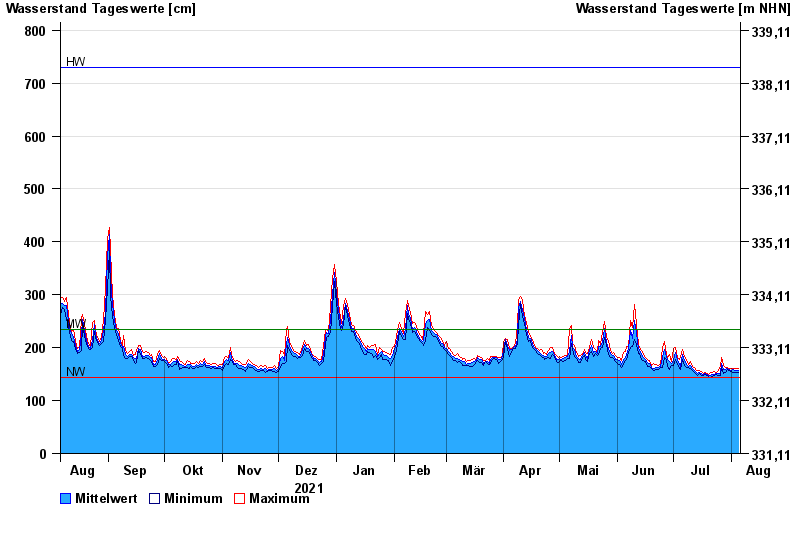
| Date | Mean value [cm] | Maximum [cm] | Minimum [cm] |
|---|---|---|---|
| 05.08.2022 | 156 | 160 | 153 |
| 04.08.2022 | 156 | 160 | 153 |
| 03.08.2022 | 157 | 161 | 153 |
| 02.08.2022 | 158 | 161 | 154 |
| 01.08.2022 | 157 | 160 | 155 |
| 31.07.2022 | 158 | 161 | 157 |
| 30.07.2022 | 160 | 162 | 158 |
© Bayerisches Landesamt für Umwelt 2024