
- Start >
- Rivers >
- Waterlevel >
- Obere Donau >
- Oberndorf >
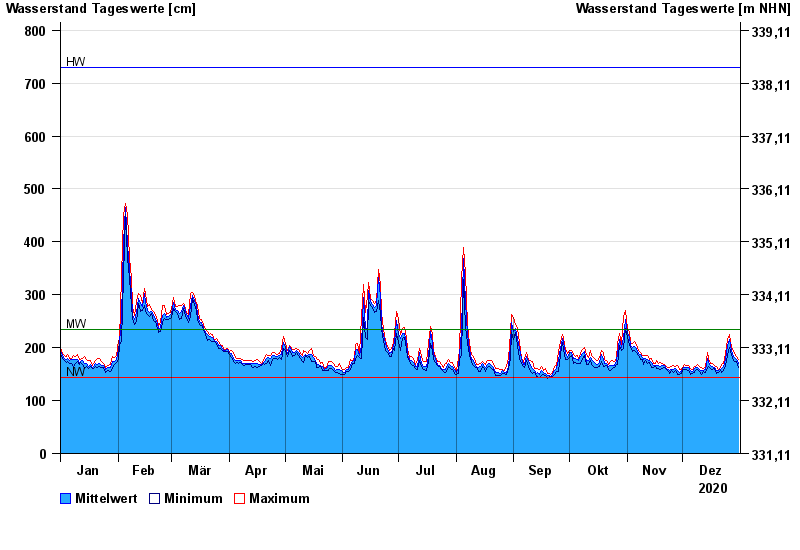
- Chart of year

Chart of year Oberndorf / Donau
Waterlevel from 01.01.2020 to 31.12.2020
| Date | Mean value [cm] | Maximum [cm] | Minimum [cm] |
|---|---|---|---|
| 31.12.2020 | 171 | 177 | 163 |
| 30.12.2020 | 178 | 183 | 173 |
| 29.12.2020 | 181 | 189 | 174 |
| 28.12.2020 | 183 | 192 | 176 |
| 27.12.2020 | 195 | 200 | 187 |
| 26.12.2020 | 215 | 224 | 200 |
| 25.12.2020 | 205 | 216 | 186 |
© Bayerisches Landesamt für Umwelt 2024