
- Start >
- Rivers >
- Waterlevel >
- Obere Donau >
- Oberndorf >
- Chart of year

Chart of year Oberndorf / Donau
Waterlevel from 01.01.2018 to 31.12.2018
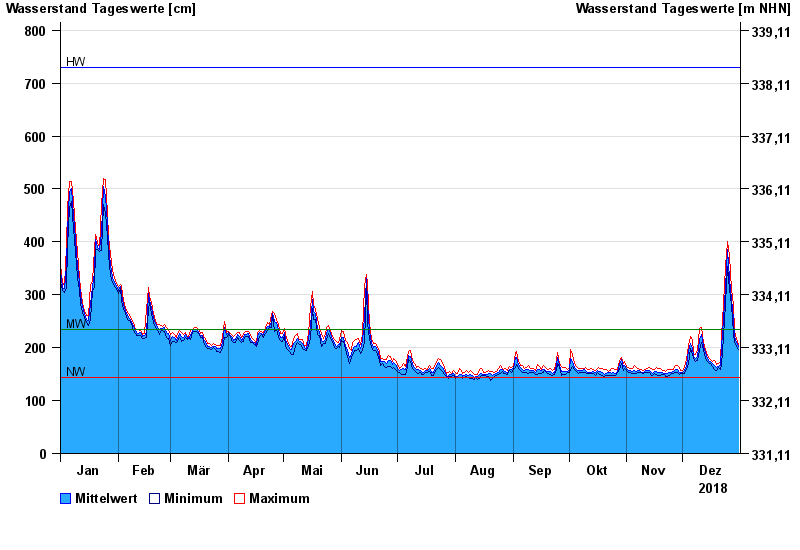
| Date | Mean value [cm] | Maximum [cm] | Minimum [cm] |
|---|---|---|---|
| 31.12.2018 | 202 | 206 | 196 |
| 30.12.2018 | 210 | 218 | 202 |
| 29.12.2018 | 221 | 230 | 210 |
| 28.12.2018 | 254 | 279 | 227 |
| 27.12.2018 | 291 | 310 | 279 |
| 26.12.2018 | 331 | 375 | 310 |
| 25.12.2018 | 386 | 401 | 353 |
© Bayerisches Landesamt für Umwelt 2024