
- Start >
- Rivers >
- Waterlevel >
- Obere Donau >
- Oberndorf >
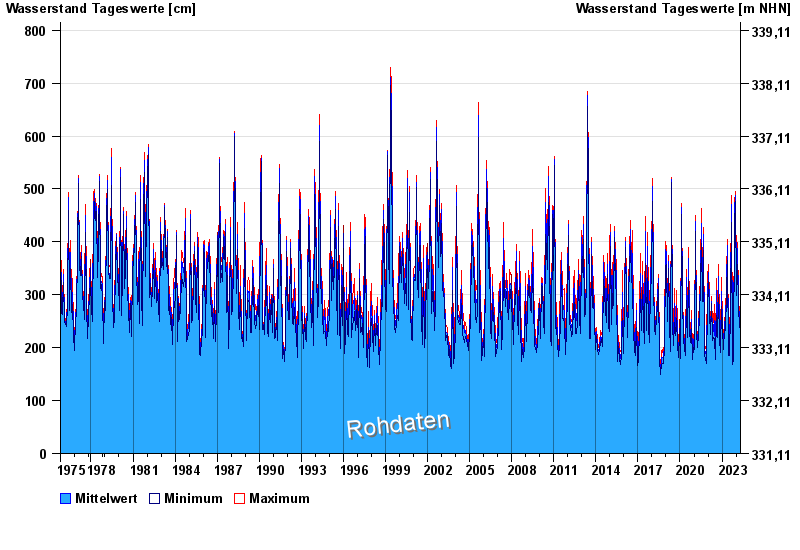
- Chart of total period

Chart of total period Oberndorf / Donau
Waterlevel from 01.11.1975 to 24.04.2024
| Date | Mean value [cm] | Maximum [cm] | Minimum [cm] |
|---|---|---|---|
| 24.04.2024 | 217 | 222 | 212 |
| 23.04.2024 | 231 | 239 | 221 |
| 22.04.2024 | 240 | 243 | 236 |
| 21.04.2024 | 243 | 252 | 234 |
| 20.04.2024 | 240 | 244 | 234 |
| 19.04.2024 | 242 | 247 | 237 |
| 18.04.2024 | 243 | 251 | 233 |
© Bayerisches Landesamt für Umwelt 2024