
- Start >
- Rivers >
- Waterlevel >
- Obere Donau >
- Oberding >
- Chart of year

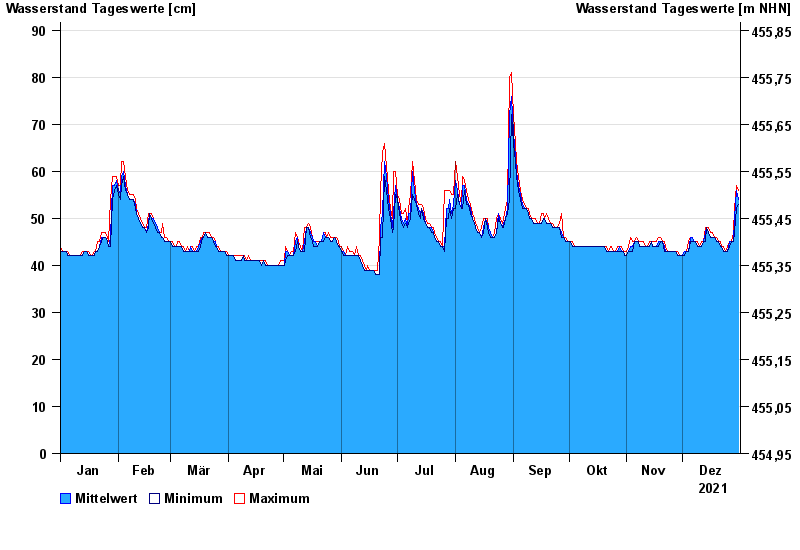
Chart of year Oberding / Gfällach
Waterlevel from 01.01.2021 to 31.12.2021
- 03.06.2013 Wasserstand: 121 cm
- 18.07.1974 Wasserstand: 120 cm
- 07.06.1995 Wasserstand: 116 cm
- 31.07.1977 Wasserstand: 114 cm
- 08.08.1978 Wasserstand: 113 cm
| Date | Mean value [cm] | Maximum [cm] | Minimum [cm] |
|---|---|---|---|
| 31.12.2021 | 54 | 56 | 53 |
| 30.12.2021 | 56 | 57 | 52 |
| 29.12.2021 | 50 | 52 | 47 |
| 28.12.2021 | 45 | 47 | 45 |
| 27.12.2021 | 45 | 45 | 45 |
| 26.12.2021 | 45 | 45 | 44 |
| 25.12.2021 | 43 | 44 | 43 |
© Bayerisches Landesamt für Umwelt 2024