
- Start >
- Rivers >
- Waterlevel >
- Obere Donau >
- Neumühle >
- Chart of year

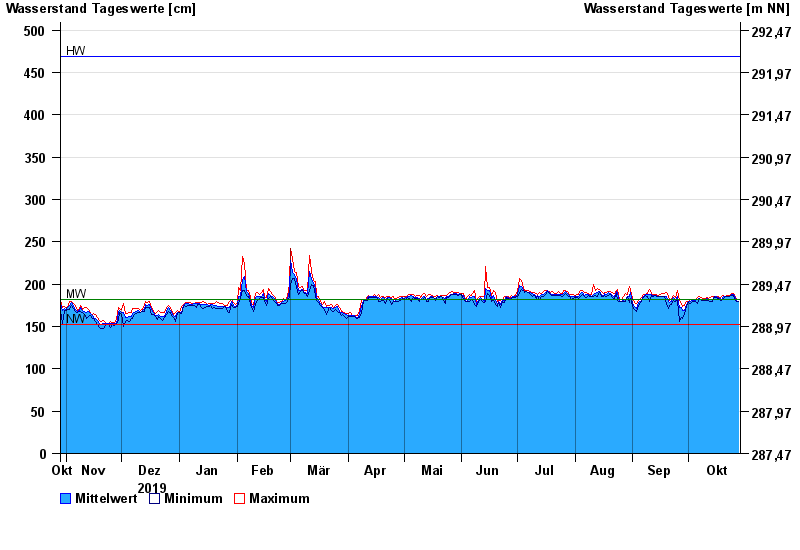
Chart of year Neumühle / Rednitz
Waterlevel from 29.10.2019 to 28.10.2020
| Date | Mean value [cm] | Maximum [cm] | Minimum [cm] |
|---|---|---|---|
| 28.10.2020 | 180 | 182 | 179 |
| 27.10.2020 | 181 | 183 | 180 |
| 26.10.2020 | 186 | 187 | 182 |
| 25.10.2020 | 188 | 189 | 187 |
| 24.10.2020 | 188 | 189 | 187 |
| 23.10.2020 | 186 | 187 | 186 |
| 22.10.2020 | 186 | 187 | 186 |
© Bayerisches Landesamt für Umwelt 2024