
- Start >
- Rivers >
- Waterlevel >
- Obere Donau >
- Neumühle >
- Chart of year

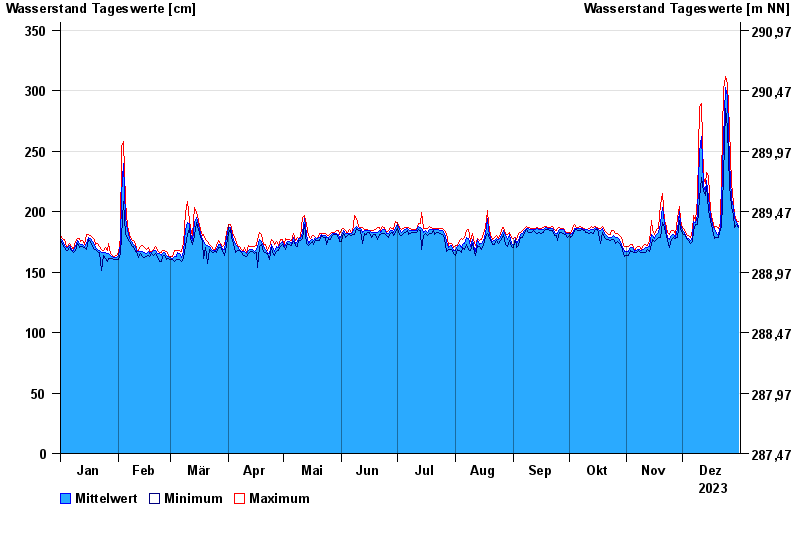
Chart of year Neumühle / Rednitz
Waterlevel from 01.01.2023 to 31.12.2023
| Date | Mean value [cm] | Maximum [cm] | Minimum [cm] |
|---|---|---|---|
| 31.12.2023 | 188 | 192 | 187 |
| 30.12.2023 | 191 | 193 | 189 |
| 29.12.2023 | 195 | 198 | 187 |
| 28.12.2023 | 203 | 207 | 197 |
| 27.12.2023 | 211 | 223 | 204 |
| 26.12.2023 | 241 | 269 | 222 |
| 25.12.2023 | 295 | 306 | 269 |
© Bayerisches Landesamt für Umwelt 2024