
- Start >
- Rivers >
- Waterlevel >
- Obere Donau >
- Neumühle >
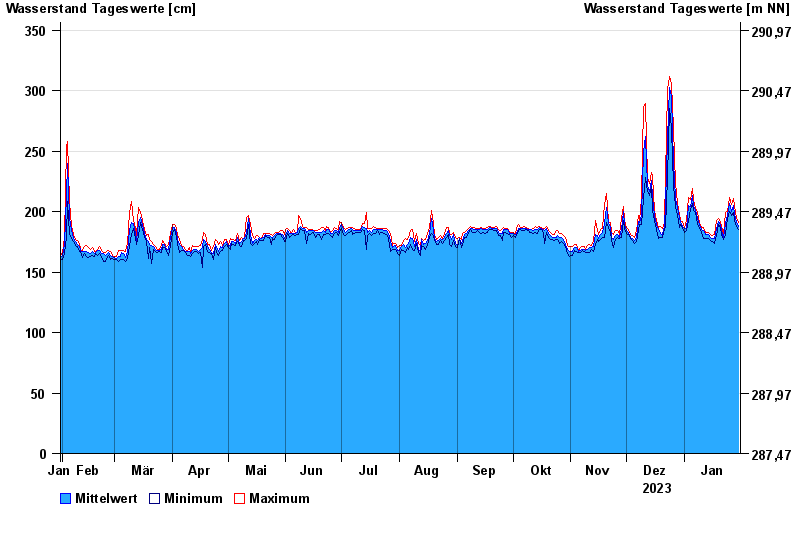
- Chart of year

Chart of year Neumühle / Rednitz
Waterlevel from 31.01.2023 to 30.01.2024
| Date | Mean value [cm] | Maximum [cm] | Minimum [cm] |
|---|---|---|---|
| 30.01.2024 | 188 | 191 | 185 |
| 29.01.2024 | 191 | 194 | 188 |
| 28.01.2024 | 198 | 204 | 193 |
| 27.01.2024 | 205 | 211 | 199 |
| 26.01.2024 | 200 | 206 | 197 |
| 25.01.2024 | 207 | 212 | 200 |
| 24.01.2024 | 197 | 200 | 194 |
© Bayerisches Landesamt für Umwelt 2024