
- Start >
- Rivers >
- Waterlevel >
- Obere Donau >
- Nattenhausen >
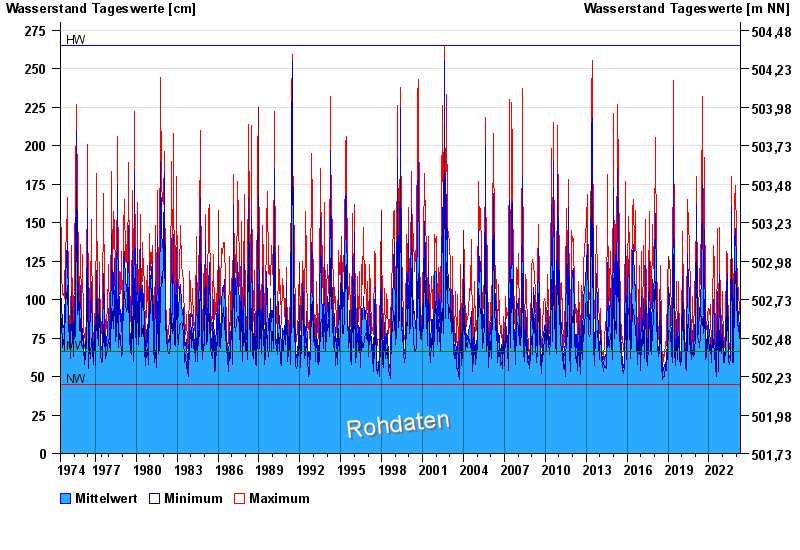
- Chart of total period

Chart of total period Nattenhausen / Günz
Waterlevel from 12.06.1974 to 25.04.2024
| Date | Mean value [cm] | Maximum [cm] | Minimum [cm] |
|---|---|---|---|
| 25.04.2024 | 69 | 70 | 67 |
| 24.04.2024 | 69 | 72 | 66 |
| 23.04.2024 | 72 | 74 | 70 |
| 22.04.2024 | 76 | 83 | 71 |
| 21.04.2024 | 77 | 84 | 75 |
| 20.04.2024 | 84 | 97 | 75 |
| 19.04.2024 | 75 | 82 | 72 |
© Bayerisches Landesamt für Umwelt 2024