
- Start >
- Rivers >
- Waterlevel >
- Obere Donau >
- Mühlstetten >
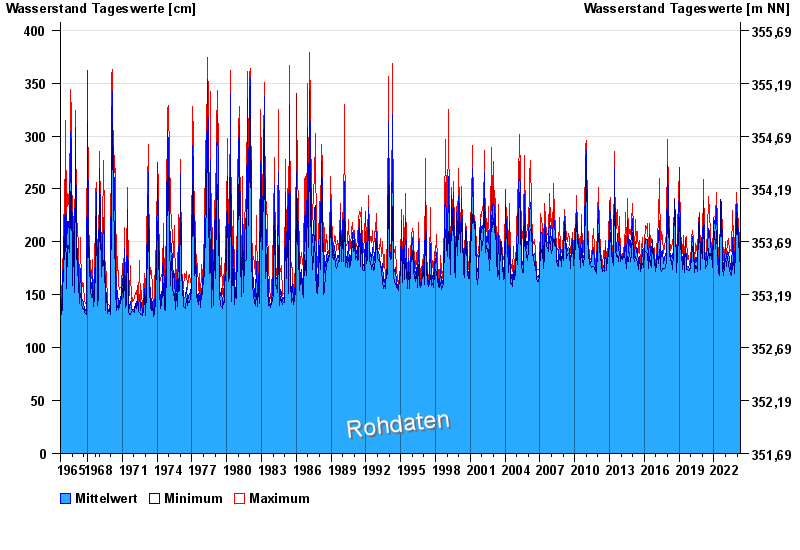
- Chart of total period

Chart of total period Mühlstetten / Schwäbische Rezat
Waterlevel from 06.09.1965 to 17.04.2024
| Date | Mean value [cm] | Maximum [cm] | Minimum [cm] |
|---|---|---|---|
| 17.04.2024 | 176 | 178 | 172 |
| 16.04.2024 | 174 | 174 | 173 |
| 15.04.2024 | 174 | 174 | 173 |
| 14.04.2024 | 173 | 173 | 173 |
| 13.04.2024 | 173 | 173 | 173 |
| 12.04.2024 | 172 | 173 | 171 |
| 11.04.2024 | 171 | 172 | 171 |
© Bayerisches Landesamt für Umwelt 2024