
- Start >
- Rivers >
- Waterlevel >
- Obere Donau >
- Manching (Ort) >
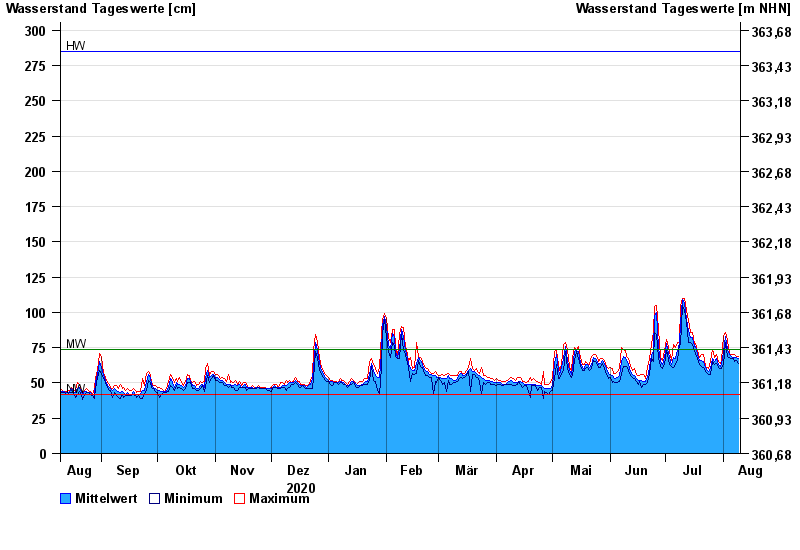
- Chart of year

Chart of year Manching (Ort) / Paar
Waterlevel from 10.08.2020 to 09.08.2021
| Date | Mean value [cm] | Maximum [cm] | Minimum [cm] |
|---|---|---|---|
| 09.08.2021 | 67 | 69 | 64 |
| 08.08.2021 | 68 | 69 | 66 |
| 07.08.2021 | 68 | 70 | 65 |
| 06.08.2021 | 68 | 70 | 67 |
| 05.08.2021 | 69 | 70 | 67 |
| 04.08.2021 | 70 | 71 | 68 |
| 03.08.2021 | 74 | 80 | 69 |
© Bayerisches Landesamt für Umwelt 2024