
- Start >
- Rivers >
- Waterlevel >
- Obere Donau >
- Lentersdorf >
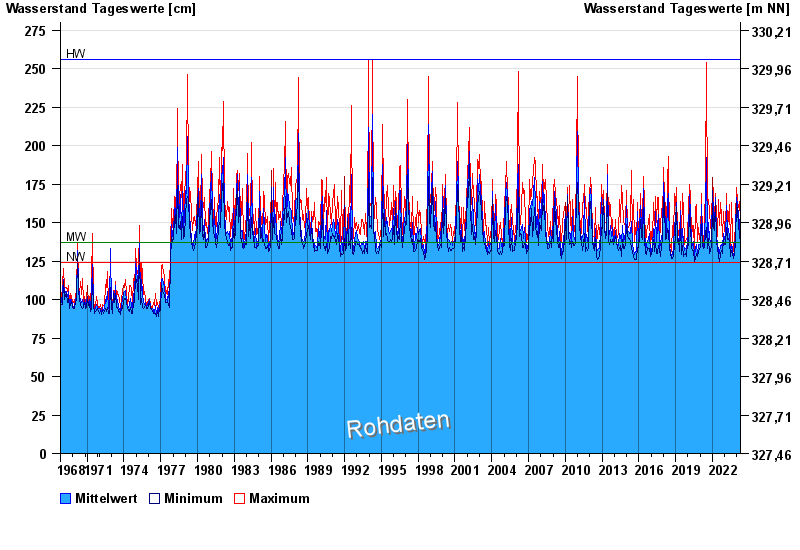
- Chart of total period

Chart of total period Lentersdorf / Bibert
Waterlevel from 28.10.1968 to 16.04.2024
| Date | Mean value [cm] | Maximum [cm] | Minimum [cm] |
|---|---|---|---|
| 16.04.2024 | 139 | 151 | 135 |
| 15.04.2024 | 136 | 138 | 134 |
| 14.04.2024 | 135 | 135 | 134 |
| 13.04.2024 | 135 | 136 | 134 |
| 12.04.2024 | 135 | 135 | 134 |
| 11.04.2024 | 135 | 137 | 135 |
| 10.04.2024 | 136 | 136 | 135 |
© Bayerisches Landesamt für Umwelt 2024