
- Start >
- Rivers >
- Waterlevel >
- Obere Donau >
- Lentersdorf >
- Chart of total period

Chart of total period Lentersdorf / Bibert
Waterlevel from 28.10.1968 to 20.04.2024
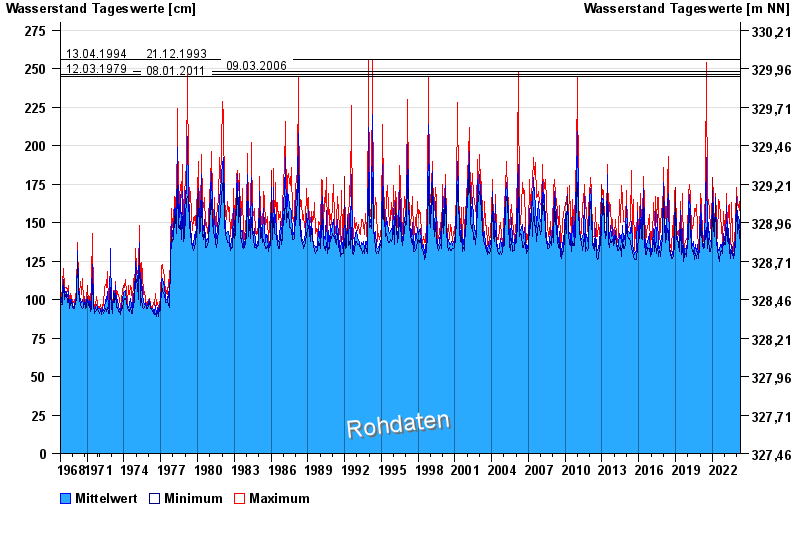
- 13.04.1994 Wasserstand: 256 cm
- 21.12.1993 Wasserstand: 256 cm
- 09.03.2006 Wasserstand: 248 cm
- 12.03.1979 Wasserstand: 246 cm
- 08.01.2011 Wasserstand: 245 cm
| Date | Mean value [cm] | Maximum [cm] | Minimum [cm] |
|---|---|---|---|
| 20.04.2024 | 142 | 145 | 139 |
| 19.04.2024 | 140 | 145 | 137 |
| 18.04.2024 | 137 | 140 | 136 |
| 17.04.2024 | 141 | 144 | 137 |
| 16.04.2024 | 139 | 151 | 135 |
| 15.04.2024 | 136 | 138 | 134 |
| 14.04.2024 | 135 | 135 | 134 |
© Bayerisches Landesamt für Umwelt 2024