
- Start >
- Rivers >
- Waterlevel >
- Obere Donau >
- Lentersdorf >
- Chart of total period

Chart of total period Lentersdorf / Bibert
Waterlevel from 28.10.1968 to 24.04.2024
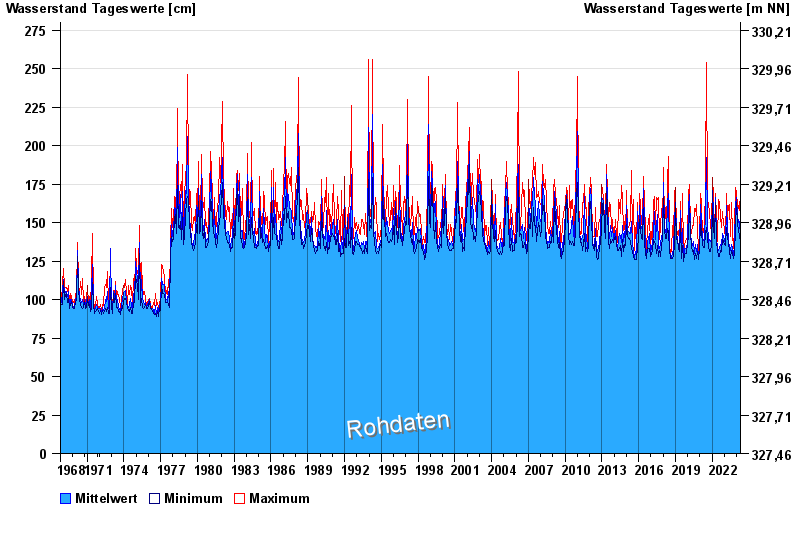
- Hochwassergefahrenfläche HQ100 290 cm
| Date | Mean value [cm] | Maximum [cm] | Minimum [cm] |
|---|---|---|---|
| 24.04.2024 | 136 | 136 | 136 |
| 23.04.2024 | 137 | 137 | 136 |
| 22.04.2024 | 139 | 141 | 137 |
| 21.04.2024 | 139 | 142 | 136 |
| 20.04.2024 | 141 | 145 | 138 |
| 19.04.2024 | 140 | 145 | 137 |
| 18.04.2024 | 137 | 140 | 136 |
© Bayerisches Landesamt für Umwelt 2024