
- Start >
- Rivers >
- Waterlevel >
- Obere Donau >
- Ingolstadt Luitpoldstraße >
- Chart of total period

Chart of total period Ingolstadt Luitpoldstraße / Donau
Waterlevel from 27.03.2003 to 24.04.2024
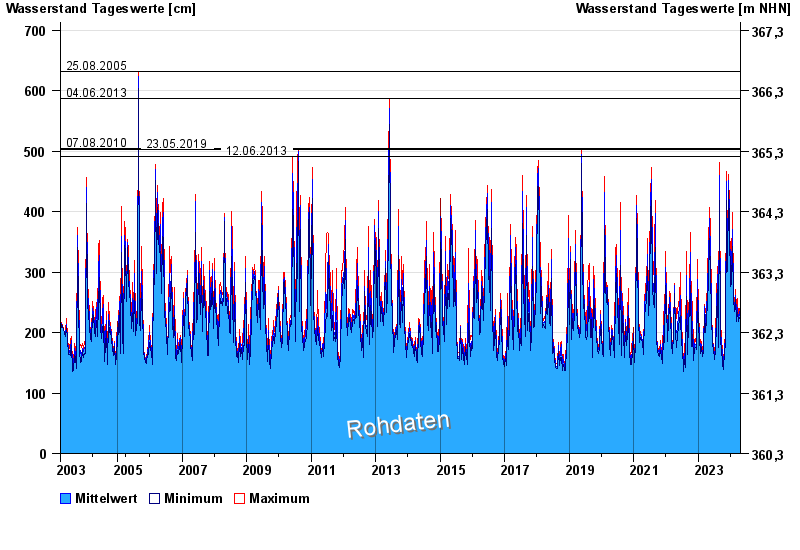
- 25.08.2005 Wasserstand: 632 cm
- 04.06.2013 Wasserstand: 587 cm
- 07.08.2010 Wasserstand: 505 cm
- 23.05.2019 Wasserstand: 503 cm
- 12.06.2013 Wasserstand: 491 cm
| Date | Mean value [cm] | Maximum [cm] | Minimum [cm] |
|---|---|---|---|
| 24.04.2024 | 201 | 205 | 196 |
| 23.04.2024 | 211 | 220 | 204 |
| 22.04.2024 | 223 | 224 | 221 |
| 21.04.2024 | 225 | 237 | 220 |
| 20.04.2024 | 229 | 237 | 223 |
| 19.04.2024 | 227 | 233 | 225 |
| 18.04.2024 | 235 | 239 | 225 |
© Bayerisches Landesamt für Umwelt 2024