
- Start >
- Rivers >
- Waterlevel >
- Obere Donau >
- Hasberg >
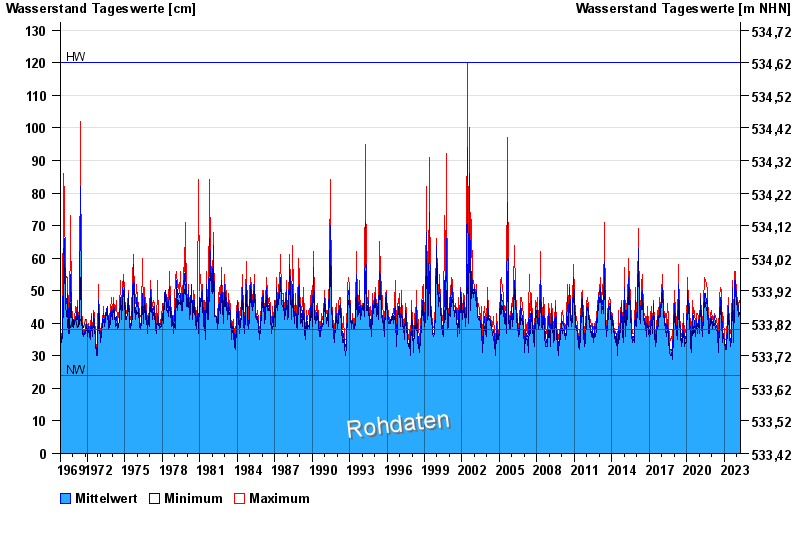
- Chart of total period

Chart of total period Hasberg / Östliche Mindel
Waterlevel from 01.11.1969 to 25.04.2024
| Date | Mean value [cm] | Maximum [cm] | Minimum [cm] |
|---|---|---|---|
| 25.04.2024 | 41 | 41 | 40 |
| 24.04.2024 | 41 | 41 | 41 |
| 23.04.2024 | 41 | 42 | 41 |
| 22.04.2024 | 42 | 43 | 41 |
| 21.04.2024 | 43 | 44 | 43 |
| 20.04.2024 | 44 | 45 | 42 |
| 19.04.2024 | 41 | 42 | 39 |
© Bayerisches Landesamt für Umwelt 2024