
- Start >
- Rivers >
- Waterlevel >
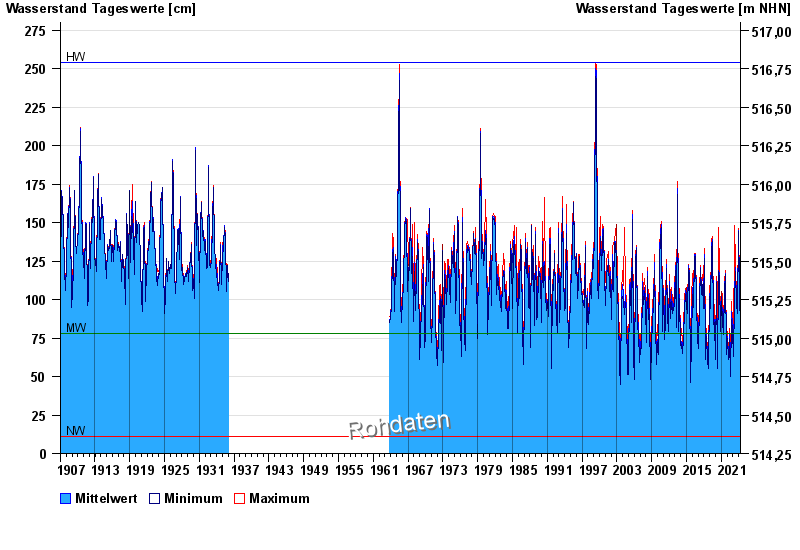
- Obere Donau >
- Fürstenfeldbruck >
- Chart of total period

Chart of total period Fürstenfeldbruck / Amper
Waterlevel from 01.02.1907 to 20.04.2024
| Date | Mean value [cm] | Maximum [cm] | Minimum [cm] |
|---|---|---|---|
| 20.04.2024 | 57 | 57 | 56 |
| 19.04.2024 | 55 | 57 | 53 |
| 18.04.2024 | 51 | 54 | 49 |
| 17.04.2024 | 49 | 54 | 38 |
| 16.04.2024 | 50 | 55 | 48 |
| 15.04.2024 | 47 | 52 | 40 |
| 14.04.2024 | 46 | 48 | 45 |
© Bayerisches Landesamt für Umwelt 2024