
- Start >
- Rivers >
- Waterlevel >
- Obere Donau >
- Freising >
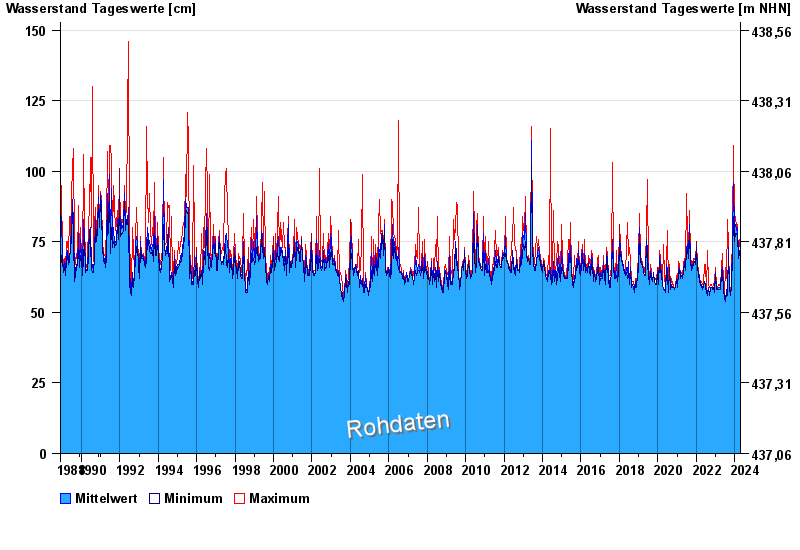
- Chart of total period

Chart of total period Freising / Moosach
Waterlevel from 01.12.1988 to 19.04.2024
 Für diesen Pegel sind keine Hochwassermarken hinterlegt.
| Date | Mean value [cm] | Maximum [cm] | Minimum [cm] |
|---|---|---|---|
| 19.04.2024 | 69 | 70 | 69 |
| 18.04.2024 | 69 | 70 | 69 |
| 17.04.2024 | 70 | 72 | 67 |
| 16.04.2024 | 67 | 68 | 67 |
| 15.04.2024 | 67 | 68 | 66 |
| 14.04.2024 | 67 | 67 | 67 |
| 13.04.2024 | 67 | 67 | 67 |
© Bayerisches Landesamt für Umwelt 2024