
- Start >
- Rivers >
- Waterlevel >
- Obere Donau >
- Eichstätt >
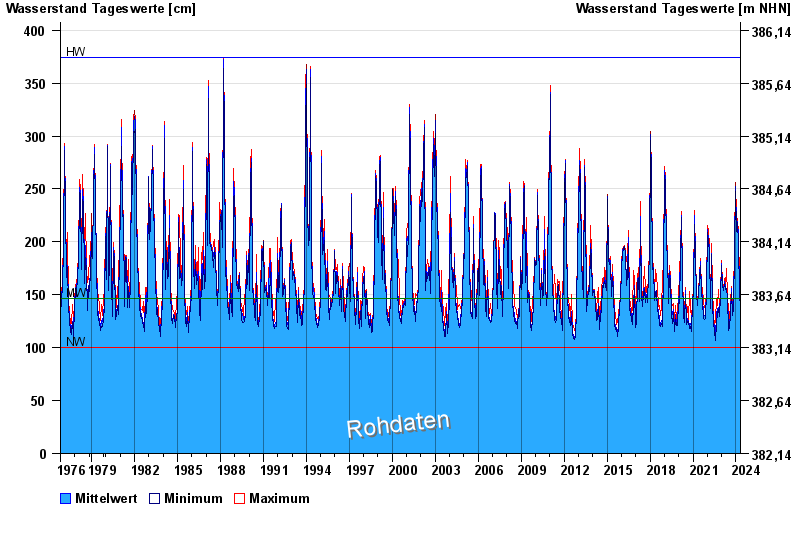
- Chart of total period

Chart of total period Eichstätt / Altmühl
Waterlevel from 01.11.1976 to 24.04.2024
| Date | Mean value [cm] | Maximum [cm] | Minimum [cm] |
|---|---|---|---|
| 24.04.2024 | 138 | 138 | 138 |
| 23.04.2024 | 138 | 139 | 138 |
| 22.04.2024 | 139 | 140 | 138 |
| 21.04.2024 | 137 | 139 | 135 |
| 20.04.2024 | 138 | 139 | 136 |
| 19.04.2024 | 135 | 136 | 133 |
| 18.04.2024 | 135 | 137 | 132 |
© Bayerisches Landesamt für Umwelt 2024