
- Start >
- Rivers >
- Waterlevel >
- Obere Donau >
- Beilngries oberh. der Sulz >
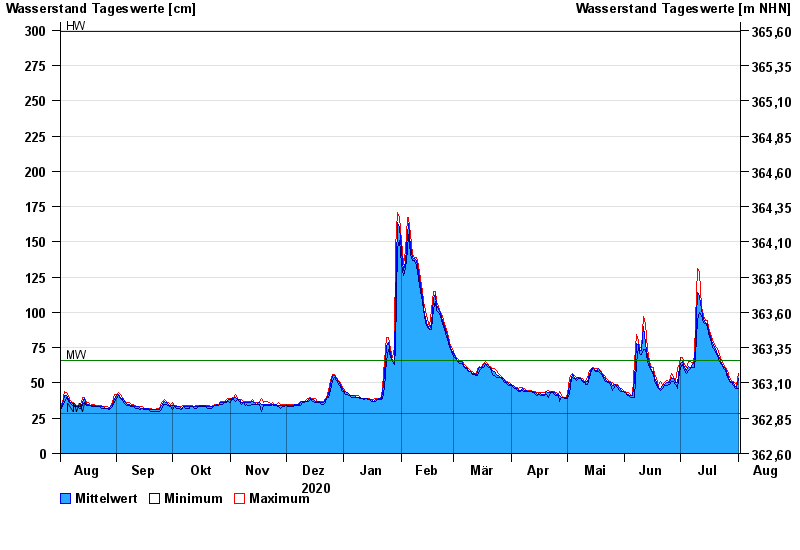
- Chart of year

Chart of year Beilngries oberh. der Sulz / Altmühl
Waterlevel from 02.08.2020 to 01.08.2021
| Date | Mean value [cm] | Maximum [cm] | Minimum [cm] |
|---|---|---|---|
| 01.08.2021 | 53 | 57 | 46 |
| 31.07.2021 | 47 | 49 | 46 |
| 30.07.2021 | 48 | 50 | 47 |
| 29.07.2021 | 50 | 51 | 48 |
| 28.07.2021 | 50 | 51 | 50 |
| 27.07.2021 | 52 | 54 | 51 |
| 26.07.2021 | 56 | 59 | 54 |
© Bayerisches Landesamt für Umwelt 2024