
- Start >
- Rivers >
- Waterlevel >
- Obere Donau >
- Beilngries oberh. der Sulz >
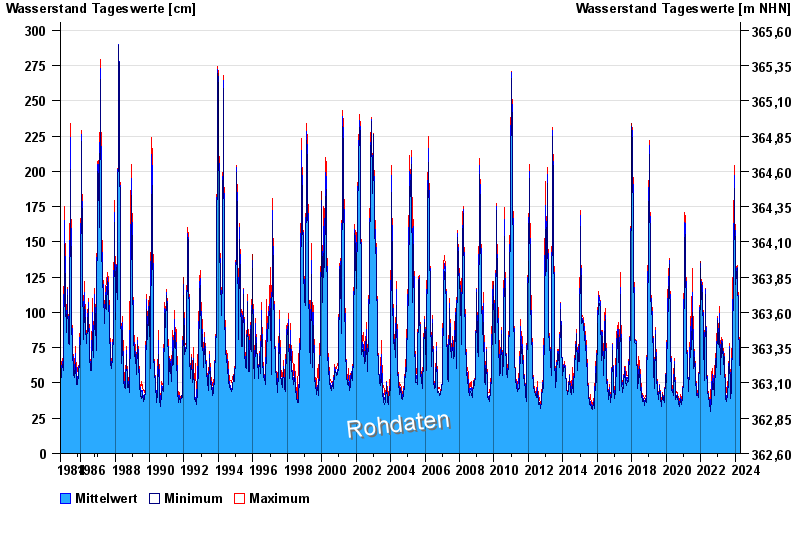
- Chart of total period

Chart of total period Beilngries oberh. der Sulz / Altmühl
Waterlevel from 01.11.1984 to 25.04.2024
| Date | Mean value [cm] | Maximum [cm] | Minimum [cm] |
|---|---|---|---|
| 25.04.2024 | 53 | 53 | 52 |
| 24.04.2024 | 54 | 56 | 53 |
| 23.04.2024 | 56 | 57 | 56 |
| 22.04.2024 | 57 | 58 | 56 |
| 21.04.2024 | 55 | 57 | 54 |
| 20.04.2024 | 52 | 54 | 51 |
| 19.04.2024 | 49 | 53 | 47 |
© Bayerisches Landesamt für Umwelt 2024