
- Start >
- Rivers >
- Waterlevel >
- Obere Donau >
- Aha >
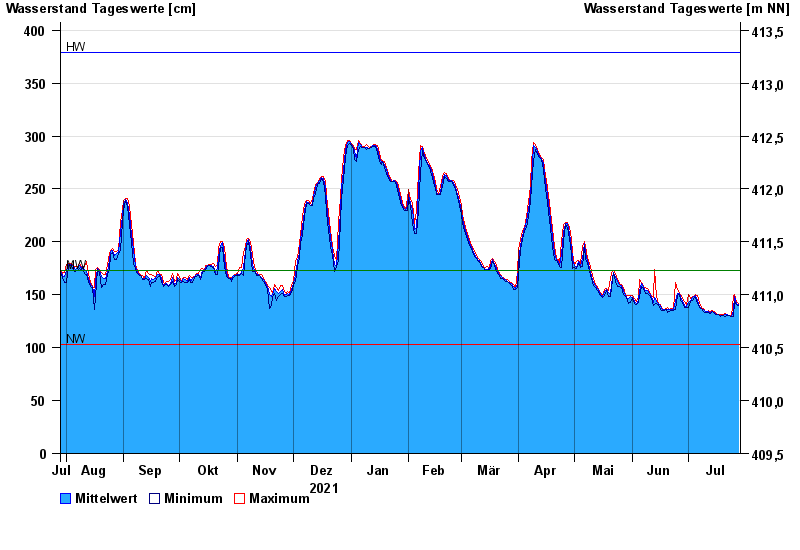
- Chart of year

Chart of year Aha / Altmühl
Waterlevel from 29.07.2021 to 28.07.2022
| Date | Mean value [cm] | Maximum [cm] | Minimum [cm] |
|---|---|---|---|
| 28.07.2022 | 141 | 142 | 140 |
| 27.07.2022 | 142 | 144 | 141 |
| 26.07.2022 | 148 | 150 | 144 |
| 25.07.2022 | 135 | 148 | 129 |
| 24.07.2022 | 129 | 130 | 129 |
| 23.07.2022 | 130 | 130 | 130 |
| 22.07.2022 | 131 | 131 | 130 |
© Bayerisches Landesamt für Umwelt 2024